
Company Website:
https://capstonemining.com/home/default.aspx
VANCOUVER, British Columbia -- (Business Wire)
Capstone Mining Corp. (“Capstone” or the “Company”) (TSX:CS) announces the results of an updated Mineral Resource estimate for the Cozamin Mine in Zacatecas, Mexico. The total Measured & Indicated (“M&I”) Resource Estimate tonnes increased by 66%, with an 83% increase to contained copper metal to 949 million pounds and a 71% increase to contained silver metal to 39 million ounces of silver. M&I Resource for Vein 20, the principal zone in the Mala Noche Footwall Zone (“MNFWZ”), increased by 118% to 13,086 kt at 2.35% Cu and 52 g/t Ag. The Company is currently updating Mineral Reserves and an updated technical report is expected in Q3 2020.
This press release features multimedia. View the full release here: https://www.businesswire.com/news/home/20200611005280/en/
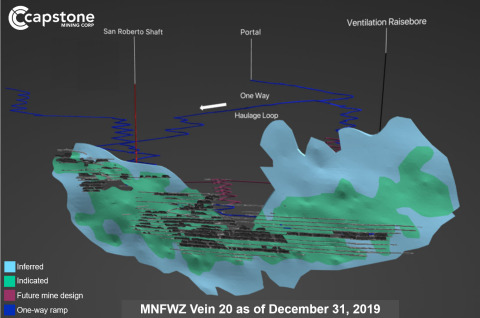
Resource Estimate for the Mala Noche Footwall Zone Vein 20 as of December 31, 2019. (Photo: Business Wire)
HIGHLIGHTS
Below is a table highlighting the changes of the new Mineral Resource Estimate, compared to December 31, 2019.
|
Measured & Indicated
Resource Estimate | As of April 30, 2020 | Compared to as of December 31, 2019 |
Copper-Silver Zones |
MNFWZ with Vein 20 defining
the “Principal Zone”
|
13,086 kt
2.35% Cu
52 g/t Ag
307.7 kt copper
21.9 million ozs silver
|
118% increase in tonnes
4% increase in copper grade
3% increase in silver grade
127% increase in contained copper metal
124% increase in contained silver ounces
|
All Veins
|
21,790 kt
1.92% Cu
46 g/t Ag
418.1 kt copper
32.3 million ozs silver
|
64% increase in tonnes
12% increase in copper grade
4% increase in silver grade
84% increase in contained copper metal
71% increase in contained silver ounces
|
Zinc-Lead-Silver Zones |
All Veins
|
4,668 kt
3.46% Zn
1.21% Pb
43 g/t Ag
161.3 kt zinc
56.3 kt lead
6.4 million ozs silver
|
72% increase in tonnes
5% lower zinc grade
26% higher lead grade
no change
63% increase in contained zinc metal
117% increase in contained lead metal
72% increase in contained silver ounces
|
Total (Copper-Silver + Zinc-Lead-Silver Zones) |
Total
|
26,458 kt
1.63% Cu
45 g/t Ag
430.5 kt copper
285.1 kt zinc
76.8 kt lead
38.7 million ozs silver
|
66% increase in tonnes
11% increase in copper grade
3% increase in silver grade
83% increase in contained copper metal
44% increase in contained zinc metal
72% increase in contained lead metal
71% increase in contained silver ounces
|
Brad Mercer, SVP Exploration and Operations said, “Since the Resource stated in the 2018 Technical Report, our exploration team has drilled 108,000 meters within a budget of US$10 million. This new Resource Estimate has exceeded our expectation to upgrade Vein 20, the principal zone in the MNFWZ, to Indicated Class, previously estimated as Inferred in 2018. We also extended high grades into a previously undrilled area, thus adding unexpected tonnage in a key part of our development plan, and luckily the vein is wider up dip which bodes well for mining costs, dilution control and lower development rates per tonne. We believe there is additional exploration potential and we are making plans to test new step-out targets in H2 2020.”
The figures below illustrate the Resource Estimate growth of Vein 20 in the MNFWZ, as of April 30, 2020 with a comparison to December 31, 2019. To see the full VRify 3D model, click HERE.
Resource Estimate of Vein 20, as of Apr 30, 2020, compared to Dec 31, 2019
-
13,086 kt, 118% increase in tonnes
-
2.35% Cu, 4% increase in copper grade
-
52 g/t Ag, 3% increase in silver grade
-
678 million lbs copper, 127% increase in contained copper metal
-
21.9 million ozs silver, 124% increase in contained silver ounce
Darren Pylot, Capstone’s President and CEO said, “These results demonstrate why I have been saying ‘the best has yet to come at Cozamin’, which is incredible given the mine has generated over US$450 million in cumulative free cash flow since 2007. We are nearly six months away from seeing a new chapter for Cozamin, as copper and silver production expands by at least 50% to over 50 million pounds of copper and 1.5 million ounces of silver per year, respectively.”
NEXT STEPS
Capstone is taking the next steps to convert Mineral Resources to Mineral Reserve and is aiming to publish an updated Mineral Reserve and technical report in Q3 2020.
There are three key infrastructure improvements required to debottleneck mine production by the end of 2020, of which the first two were completed early in Q2 2020:
-
a new 818m long ventilation raise,
-
increased underground electrical substation capacity, and
-
a new section of ramp to complete a one-way traffic circuit, remains on schedule for completion in Q4 2020.
We are currently looking at opportunities to further increase value, such as paste backfill and improved mining dilution control, and will report the status of these either in the technical report update in Q3 or later in 2020.
TABLE 1 – Estimate of Copper-Silver Zone Mineral Resources by Class at a US$50 NSR/t Cut-off as at April 30, 2020 |
Classification | Tonnes
(kt) | Copper
(%) | Silver
(g/t) | Zinc
(%) | Lead
(%) | Copper
Metal
(kt) | Silver
Metal
(koz) | Zinc
Metal
(kt) | Lead
Metal
(kt) |
MNFWZ Vein 20 |
Measured (M)
|
-
|
-
|
-
|
-
|
-
|
-
|
-
|
-
|
-
|
Indicated (I)
|
13,086
|
2.35
|
52
|
0.33
|
0.03
|
308
|
21,936
|
43
|
4
|
Total M + I | 13,086 | 2.35 | 52 | 0.33 | 0.03 | 308 | 21,936 | 43 | 4 |
Inferred
|
3,068
|
1.41
|
45
|
0.67
|
0.04
|
43
|
4,441
|
21
|
1
|
MNFWZ Other Copper-Silver Veins |
Measured (M)
|
-
|
-
|
-
|
-
|
-
|
-
|
-
|
-
|
-
|
Indicated (I)
|
5,383
|
1.38
|
31
|
0.58
|
0.07
|
74
|
5,412
|
31
|
4
|
Total M + I | 5,383 | 1.38 | 31 | 0.58 | 0.07 | 74 | 5,412 | 31 | 4 |
Inferred
|
1,448
|
1.38
|
36
|
0.97
|
0.13
|
20
|
1,693
|
14
|
2
|
MNV San Roberto Copper-Silver Zone |
Measured (M)
|
407
|
1.24
|
53
|
1.23
|
0.40
|
5
|
698
|
5
|
2
|
Indicated (I)
|
2,914
|
1.06
|
45
|
1.55
|
0.39
|
31
|
4,206
|
45
|
11
|
Total M + I | 3,321 | 1.08 | 46 | 1.51 | 0.39 | 36 | 4,903 | 50 | 13 |
Inferred
|
3,813
|
0.70
|
37
|
1.53
|
0.14
|
27
|
4,555
|
58
|
5
|
Total – Copper-Silver Zones |
Measured (M)
|
407
|
1.24
|
53
|
1.23
|
0.40
|
5
|
698
|
5
|
2
|
Indicated (I)
|
21,383
|
1.93
|
46
|
0.56
|
0.09
|
413
|
31,591
|
119
|
19
|
Total M + I | 21,790 | 1.92 | 46 | 0.57 | 0.09 | 418 | 32,284 | 124 | 20 |
Inferred
|
8,330
|
1.08
|
40
|
1.12
|
0.10
|
90
|
10,689
|
93
|
9
|
Mineral Resources are classified according to CIM (2014) definitions, estimated following CIM (2019) guidelines and have an effective date of April 30, 2020. Mineral Resources are reported inclusive of Mineral Reserves. Mineral Resources that are not Mineral Reserves do not have demonstrated economic viability. The independent Qualified Person for the estimates is Mr. Garth D. Kirkham, P. Geo., FGC., of Kirkham Geosystems Ltd. Mineral Resources are reported using NSR350 formula: Cu*65.024 + Ag*0.438 + Zn*10.755 + Pb*6.981. Metal price assumptions (in US$) used to calculate the NSR for all deposits are: Cu = $3.50/lb, Ag = $18.00/oz, Zn = $1.20/lb, and Pb = $1.00/lb. An exchange rate of MX$18.50 per US$1 is assumed. The following metal recoveries are used: 90% Cu, 74% Ag, 79% Zn, 76% Pb. Totals may not sum exactly due to rounding. The NSR cut-off of US$50/tonne is based on historical mining and milling costs plus general and administrative costs. The Mineral Resources consider underground mining by long-hole stoping and mineral processing by flotation. No dilution is incorporated in the Mineral Resource. All metals are reported as contained. Mineral Resource estimates do not account for mineability, selectivity, mining loss and dilution. These Mineral Resource estimates include Inferred Mineral Resources considered too speculative geologically to apply economic considerations for categorization as Mineral Reserves. However, it is reasonably expected that the majority of Inferred Mineral Resources could be upgraded to Indicated Resources.
|
The current Mineral Reserves at the MNFWZ are primarily located in the principal vein, Vein 20, with some additional material within an adjacent structure called Vein 10, that are actively being mined. These two veins, of the eight MNFWZ veins modeled, are best suited to the current mining method and are the principal target of an upcoming mineral reserve estimate predicated on the large increase in Indicated Class Mineral Resources. The potential of the remaining six veins represent a future exploration opportunity. Because of their relative position in the hanging wall, five of the six adjacent MNFWZ veins are intercepted coincidentally by drill holes targeting the principal ore structures, Vein 20 and Vein 10. All holes are terminated after testing for Vein 22 in the Footwall of the principal ore zone, Vein 20. Therefore, each drill hole testing the principal targets incidentally adds to our knowledge base for all other veins.
TABLE 2 – Estimate for Zinc-Lead-Silver Zone Mineral Resources by Class at a US$50 NSR/t Cut-off as at April 30, 2020 |
Classification | Tonnes
(kt) | Copper
(%) | Silver
(g/t) | Zinc
(%) | Lead
(%) | Copper
Metal
(kt) | Silver
Metal
(koz) | Zinc
Metal
(kt) | Lead
Metal
(kt) |
MNFWZ Zinc-Lead-Silver Veins |
Measured (M)
|
-
|
-
|
-
|
-
|
-
|
-
|
-
|
-
|
-
|
Indicated (I)
|
2,830
|
0.25
|
42
|
3.33
|
1.63
|
7
|
3,821
|
94
|
46
|
Total M + I |
2,830
|
0.25
|
42
|
3.33
|
1.63
|
7
|
3,821
|
94
|
46
|
Inferred
|
2,682
|
0.21
|
37
|
4.28
|
2.60
|
6
|
3,182
|
115
|
70
|
MNV San Rafael Zinc-Lead-Silver Zone |
Measured (M)
|
-
|
-
|
-
|
-
|
-
|
-
|
-
|
-
|
-
|
Indicated (I)
|
1,570
|
0.30
|
46
|
3.59
|
0.52
|
5
|
2,312
|
56
|
8
|
Total M + I |
1,570
|
0.30
|
46
|
3.59
|
0.52
|
5
|
2,312
|
56
|
8
|
Inferred
|
3,060
|
0.24
|
37
|
3.26
|
0.35
|
7
|
3,633
|
100
|
11
|
MNV San Roberto Zinc-Lead-Silver Zone |
Measured (M)
|
-
|
-
|
-
|
-
|
-
|
-
|
-
|
-
|
-
|
Indicated (I)
|
268
|
0.20
|
31
|
4.05
|
0.72
|
1
|
270
|
11
|
2
|
Total M + I |
268
|
0.20
|
31
|
4.05
|
0.72
|
1
|
270
|
11
|
2
|
Inferred
|
523
|
0.13
|
25
|
3.49
|
0.43
|
1
|
423
|
18
|
2
|
Total – Zinc-Lead-Silver Zones |
Measured (M)
|
-
|
-
|
-
|
-
|
-
|
-
|
-
|
-
|
-
|
Indicated (I)
|
4,668
|
0.27
|
43
|
3.46
|
1.21
|
12
|
6,403
|
161
|
56
|
Total M + I |
4,668
|
0.27
|
43
|
3.46
|
1.21
|
12
|
6,403
|
161
|
56
|
Inferred
|
6,265
|
0.22
|
36
|
3.71
|
1.32
|
14
|
7,239
|
233
|
83
|
Mineral Resources are classified according to CIM (2014) definitions, estimated following CIM (2019) guidelines and have an effective date of April 30, 2020. Mineral Resources are reported inclusive of Mineral Reserves. Mineral Resources that are not Mineral Reserves do not have demonstrated economic viability. The independent Qualified Person for the estimates is Mr. Garth D. Kirkham, P. Geo., FGC., of Kirkham Geosystems Ltd. Mineral Resources are reported using NSR350 formula: Cu*65.024 + Ag*0.438 + Zn*10.755 + Pb*6.981. Metal price assumptions (in US$) used to calculate the NSR for all deposits are: Cu = $3.50/lb, Ag = $18.00/oz, Zn = $1.20/lb, and Pb = $1.00/lb. An exchange rate of MX$18.50 per US$1 is assumed. The following metal recoveries are used: 90% Cu, 74% Ag, 79% Zn, 76% Pb. Totals may not sum exactly due to rounding. The NSR cut-off of US$50/tonne is based on historical mining and milling costs plus general and administrative costs. The Mineral Resources considers underground mining by long-hole stoping and mineral processing by flotation. No dilution is incorporated in the Mineral Resource. All metals are reported as contained. Mineral Resource estimates do not account for mineability, selectivity, mining loss and dilution. These Mineral Resource estimates include Inferred Mineral Resources considered too speculative geologically to apply economic considerations for categorization as Mineral Reserves. However, it is reasonably expected that the majority of Inferred Mineral Resources could be upgraded to Indicated Resources.
TABLE 3 – Estimate for All Zones Mineral Resources by Class at a US$50 NSR/t Cut-off as at April 30, 2020 |
Classification | Tonnes
(kt) | Copper
(%) | Silver
(g/t) | Zinc
(%) | Lead
(%) | Copper
Metal
(kt) | Silver
Metal
(koz) | Zinc
Metal
(kt) | Lead
Metal
(kt) |
All Zones (Copper-Silver + Zinc-Lead-Silver) |
Measured (M)
|
407
|
1.24
|
53
|
1.23
|
0.40
|
5
|
698
|
5
|
2
|
Indicated (I)
|
26,051
|
1.63
|
45
|
1.08
|
0.29
|
425
|
37,993
|
280
|
75
|
Total M + I |
26,458
|
1.63
|
45
|
1.08
|
0.29
|
431
|
38,687
|
285
|
77
|
Inferred
|
14,594
|
0.71
|
38
|
2.23
|
0.62
|
104
|
17,928
|
326
|
91
|
|
Mineral Resources are classified according to CIM (2014) definitions, estimated following CIM (2019) guidelines and have an effective date of April 30, 2020. Mineral Resources are reported inclusive of Mineral Reserves. Mineral Resources that are not Mineral Reserves do not have demonstrated economic viability. The independent Qualified Person for the estimates is Mr. Garth D. Kirkham, P. Geo., FGC., of Kirkham Geosystems Ltd. Mineral Resources are reported using NSR350 formula: Cu*65.024 + Ag*0.438 + Zn*10.755 + Pb*6.981. Metal price assumptions (in US$) used to calculate the NSR for all deposits are: Cu = $3.50/lb, Ag = $18.00/oz, Zn = $1.20/lb, and Pb = $1.00/lb. An exchange rate of MX$18.50 per US$1 is assumed. The following metal recoveries are used: 90% Cu, 74% Ag, 79% Zn, 76% Pb. Totals may not sum exactly due to rounding. The NSR cut-off of US$50/tonne is based on historical mining and milling costs plus general and administrative costs. The Mineral Resources considers underground mining by long-hole stoping and mineral processing by flotation. No dilution is incorporated in the Mineral Resource. All metals are reported as contained. However, it is reasonably expected that the majority of Inferred Mineral Resources could be upgraded to Indicated Resources.
Mineral Resources that are not Mineral Reserves do not have demonstrated economic viability. Mineral Resource estimates do not account for mineability, selectivity, mining loss and dilution. These Mineral Resource estimates include Inferred Mineral Resources considered too speculative geologically to apply economic considerations for categorization as Mineral Reserves.
MINERAL RESOURCE ESTIMATE METHODOLOGY
The Mineral Resource estimate reported herein was prepared by Garth Kirkham of Kirkham Geosystems Ltd. of Burnaby, BC, Canada, an Independent Qualified Person under Canadian Securities Administrators’ National Instrument 43-101 (“NI 43-101”). The Mineral Resources presented herein have been estimated in conformity with generally accepted CIM “Estimation of Mineral Resource and Mineral Reserves Best Practices” guidelines and are reported in accordance with NI 43-101. Mineral resources that are not Mineral Reserves do not have demonstrated economic viability. The estimate was completed using MineSightTM software using a three-dimensional block model (12 metre by 5 metre by 10 metre block size with 4 metre by 0.5 metre by 5 metre sub-blocks). The MNFWZ model is comprised of eight interpreted three-dimensional wireframes which were the primary estimation domains and hard boundaries were used to constrain the interpolation of grades into the block model. Interpolation parameters have been derived based on geostatistical analysis conducted on 1 metre composited drill holes. Block grades have been estimated using Ordinary Kriging (OK) methodology and the mineral resources have been classified based on proximity to sample data and the continuity of mineralization in accordance with CIM Definition Standards along with Mineral Resource and Mineral Reserve Estimation Best Practice Guidelines (2019). The MNFWZ resource has been estimated using a total of 1,128 diamond drill holes with 4,371 sample composites.
ABOUT CAPSTONE MINING CORP.
Capstone Mining Corp. is a Canadian base metals mining company, focused on copper. Our two producing mines are the Pinto Valley copper mine located in Arizona, US and the Cozamin copper-silver mine in Zacatecas State, Mexico. In addition, Capstone has the large scale 70% owned copper-iron Santo Domingo development project in Region III, Chile, in partnership with Korea Resources Corporation, as well as a portfolio of exploration properties. Capstone's strategy is to focus on the optimization of operations and assets in politically stable, mining-friendly regions, centred in the Americas. We are committed to the responsible development of our assets and the environments in which we operate. Our headquarters are in Vancouver, Canada and we are listed on the Toronto Stock Exchange (TSX). Further information is available at www.capstonemining.com.
CAUTIONARY NOTE REGARDING FORWARD-LOOKING INFORMATION
This news release, and the documents incorporated by reference herein, contains “forward-looking information” within the meaning of Canadian securities legislation and “forward-looking statements” within the meaning of the United States Private Securities Litigation Reform Act of 1995 (collectively, “forward-looking statements”). These forward-looking statements are made as of the date of this document and Capstone Mining Corp. (“Capstone” or the “Company”) does not intend, and does not assume any obligation, to update these forward-looking statements, except as required under applicable securities legislation. Forward-looking statements relate to future events or future performance and reflect our expectations or beliefs regarding future events. Forward-looking statements include, but are not limited to, statements with respect to the continuing success of mineral exploration, Capstone’s ability to fund future exploration activities, the estimation of mineral resources and mineral reserves, the realization of mineral reserve estimates, the timing and amount of estimated future production, costs of production and capital expenditures, the success of our mining operations, the estimations for potential quantities and grade of inferred resources and exploration targets, environmental risks, unanticipated reclamation expenses and title disputes. In certain cases, forward-looking statements can be identified by the use of words such as “plans”, “expects”, “aiming”, “approximately”, “guidance”, “scheduled”, “target”, “estimates”, “forecasts”, “extends”, “convert”, “potential”, “intends”, “anticipates”, “believes” or variations of such words and phrases, or statements that certain actions, events or results “may”, “could”, “should”, “would”, “will”, “might” or “will be taken”, “occur” or “be achieved” or the negative of these terms or comparable terminology. By their very nature, forward-looking statements involve known and unknown risks, uncertainties and other factors that may cause our actual results, performance or achievements to be materially different from any future results, performance or achievements expressed or implied by the forward-looking statements. Such factors include, amongst others, risks related to inherent hazards associated with mining operations and closure of mining projects, the inherent uncertainty of mineral exploration and estimations of exploration targets, potential delays in exploration due to COVID-19 or governmental action, future prices of copper and other metals, compliance with financial covenants, surety bonding, our ability to raise capital or fund explorations, Capstone’s ability to acquire properties for growth, counterparty risks associated with sales of our metals, foreign currency exchange rate fluctuations, changes in general economic conditions, accuracy of mineral resource and mineral reserve estimates, operating in foreign jurisdictions with risk of changes to governmental regulation, compliance with governmental regulations, compliance with environmental laws and regulations, reliance on approvals, licences and permits from governmental authorities, impact of climatic conditions on our operations, aboriginal title claims and rights to consultation and accommodation, land reclamation and mine closure obligations, uncertainties and risks related to the potential development of the Cozamin project, increased operating and capital costs, challenges to title to our mineral properties, maintaining ongoing social license to operate, dependence on key management personnel, potential conflicts of interest involving our directors and officers, corruption and bribery, limitations inherent in our insurance coverage, labour relations, increasing energy prices, competition in the mining industry, risks associated with joint venture partners, our ability to integrate new acquisitions into our operations, cybersecurity threats, legal proceedings, and other risks of the mining industry as well as those factors detailed from time to time in the Company’s interim and annual financial statements and MD&A of those statements, all of which are filed and available for review under the Company’s profile on SEDAR at www.sedar.com. Although the Company has attempted to identify important factors that could cause our actual results, performance or achievements to differ materially from those described in our forward-looking statements, there may be other factors that cause our results, performance or achievements not to be as anticipated, estimated or intended. There can be no assurance that our forward-looking statements will prove to be accurate, as our actual results, performance or achievements could differ materially from those anticipated in such statements. Accordingly, readers should not place undue reliance on our forward-looking statements.
NATIONAL INSTRUMENT 43-101 COMPLIANCE
Unless otherwise indicated, Capstone has prepared the technical information in this news release (“Technical Information”) based on information contained in the technical reports, news releases and MD&A’s (collectively the “Disclosure Documents”) available under Capstone Mining Corp.’s company profile on SEDAR at www.sedar.com. Each Disclosure Document was prepared by, or under the supervision of, a qualified person (a “Qualified Person”) as defined in National Instrument 43-101 Standards of Disclosure for Mineral Projects of the Canadian Securities Administrators (“NI 43-101”). Readers are encouraged to review the full text of the Disclosure Documents which qualifies the Technical Information. Readers are advised that mineral resources that are not mineral reserves do not have demonstrated economic viability. The Disclosure Documents are each intended to be read as a whole, and sections should not be read or relied upon out of context. The Technical Information is subject to the assumptions and qualifications contained in the Disclosure Documents.
The Technical Information in this news release has been prepared in accordance with NI 43-101 and reviewed and approved by Brad Mercer, P. Geol., Capstone's Senior Vice President, Operations and Exploration, a Qualified Person and the person who oversees exploration activities on the Cozamin Mine property.

View source version on businesswire.com: https://www.businesswire.com/news/home/20200611005280/en/
Contacts:
FOR FURTHER INFORMATION:
Jerrold Annett, VP, Strategy and Capital Markets
416-572-2272
jannett@capstonemining.com
Virginia Morgan, Manager, IR and Communications
604-674-2268
vmorgan@capstonemining.com
Source: Capstone Mining Corp.
© 2025 Canjex Publishing Ltd. All rights reserved.