
Company Website:
http://www.roxgold.com
TORONTO -- (Business Wire)
Roxgold Inc. (“Roxgold” or the “Company”) (TSX: ROXG) (OTCQX: ROGFF) today reported its third quarter and first nine months financial results for the period ended September 30, 2020.
This press release features multimedia. View the full release here: https://www.businesswire.com/news/home/20201110006233/en/
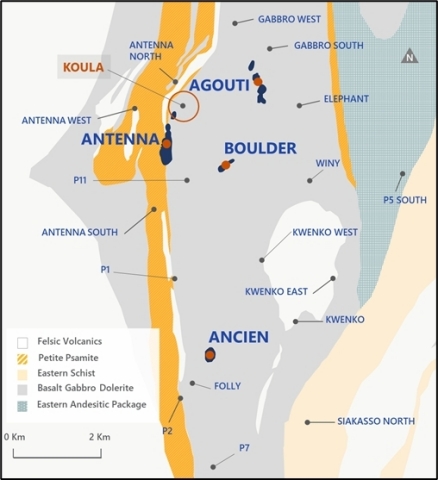
Fig 1. Seguela Location Plan (Graphic: Business Wire)
For complete details of the unaudited Condensed Interim Consolidated Financial Statements and associated Interim Management’s Discussion and Analysis please refer to the Company’s filings on SEDAR (www.sedar.com) or the Company’s website (www.roxgold.com). All amounts are in U.S. dollars unless otherwise indicated.
Q3 2020 Highlights:
During the three and nine-month period ended September 30, 2020, the Company:
Operations
-
Produced 33,557 ounces of gold at an average grade of 7.7 grams per tonne in Q3 2020, totalling 98,749 ounces produced for YTD 2020
-
Reported quarterly plant throughput of 1,424 tonnes per day ("tpd") for a total of 131,029 tonnes which exceeded increased nameplate capacity of 1,100 tpd by approximately 29%
-
Maintained upper end of annual gold production guidance between 120,000 and 130,000 ounces subject to existing operating conditions being maintained
-
Reported an interim Reserves and Resources estimate at Yaramoko with total Proven and Probable Mineral Reserves increasing by 8% to 710,000 ounces of gold replacing depletion of 207,396 ounces during the period from December 31, 2018 to June 30, 2020. Measured and Indicated Mineral Resources increased 4% to 857,000 ounces of gold, increasing the mineral endowment of Measured and Indicated Resources plus cumulative production to date at Yaramoko to 1.4 million ounces
Financial
-
Sold 30,401 ounces of gold for a total of $57.4 million in gold sales (34,200 ounces1 and $50.2 million1 respectively in Q3 2019) and 96,806 ounces for $167.5 million YTD 2020 (100,100 ounces1 and $136.0 million1 respectively YTD 2019)
-
Cash and doré on hand increased by $11.4 million over the quarter after growth expenditure of $7.9 million
-
Achieved EBITDA2 of $20.6 million in Q3 2020 compared to $16.5 million in Q3 2019
-
Generated cash flow from mining operations2 totalling $28.2 million for cash flow from mining operations per share2 of $0.08 (C$0.10/share)
-
Adjusted net income2 of $10.6 million ($0.03 per share) compared to $7.7 million ($0.02 per share) in Q3 2019
-
Produced a mine operating margin2 of $1,152 per ounce in Q3 2020 and a return on equity2 of 18%
Growth
-
Received Environmental and Social Impact Assessment approval and advanced drilling at the Séguéla Gold Project to support the upcoming Feasibility Study which remains on track for the first half of 2021
-
Announced discovery of the Koula prospect, at Séguéla, with over 40 holes drilled to date demonstrating wide intersections of high grades, including 109 g/t over 4m in hole SGRC919 and 26.1 g/t over 19m in hole SGRC877
-
Tested additional mineralization corridors at Boussoura, in southern Burkina Faso, identifying over 9 mineralized vein sets over 4 vein corridors with high grade results such as 4.8m at 26.9g/t Au from BSR-20-RD-FFR-040 and 9m at 10.7g/t Au from BSR-20-RC-FFR-063
Safety
-
Reported one Lost Time Injury ("LTI") incident at Yaramoko. This was the first LTI incident at Yaramoko since September 2018
-
Management of the current global COVID-19 crisis is ongoing with operations at Yaramoko not materially impacted with heightened preventative measures and response plans in place to mitigate and minimize any potential impacts. Operations continue to operate with reduced personnel due to COVID-19 travel restrictions and protection protocols. The Company is continually assessing the health and safety risks to the Company's personnel and contractors at its operations and offices
“The Yaramoko Mine Complex has continued to outperform this year as the mine is on track to achieve the upper end of our guidance with record margins,” commented John Dorward, President and CEO of Roxgold. “In the quarter, we achieved adjusted net income of US$10.6 million, generated over US$28 million in cash flow from mining operations and reported a return on equity of 18%. Our financial performance has been driven by the strong operational performance with 98,749 ounces of gold produced in the first nine months of this year, putting the company well on its way towards hitting the upper end of our annual production guidance of 120,000 to 130,000 ounces. Today, we also announced an updated Mineral Reserve and Mineral Resource estimate for Yaramoko, which saw the mine grow its Mineral Reserves by 7% to 710,000 ounces of gold and Measured and Indicated Mineral Resources by 4% to 857,000 ounces of gold. This increase demonstrates the ability of Yaramoko to continue to replace production, reinforcing the project as a stable foundation of long-term production and free cash flow generation for Roxgold’s ambitious growth plans.
“Our global teams continue to manage the operational challenges related to the ongoing COVID pandemic to ensure a safe and secure working environment for our employees, contractors and local communities. The travel restrictions and distancing protocols that have been effective in curtailing the impacts of the coronavirus have necessitated adjusted schedules of mining personnel with correspondent impacts on mining volumes and costs. Despite these challenges, we have continued to strengthen our balance sheet, with cash and doré on hand increasing by $11.4 million to $56.4 million, while maintaining good momentum on production over the quarter.
“Looking ahead, the Séguéla Gold Project in Cote d’Ivoire continues to return excellent exploration results as the project progresses towards the completion of the Feasibility and construction decision in the first half of next year – which will put the project on track for pouring first gold in 2022. Séguéla saw notable developments last quarter, including the approval of the Environmental and Social Impact Assessment and the discovery of the newest high-grade deposit – Koula. Initial site works will be commenced soon to enable a rapid construction ramp up following completion of the Feasibility Study. We currently have four drills turning at Séguéla, with a focus on extension and infill drilling at Koula and the continued scout testing of the extensive portfolio of targets within our land package.”
Q3 2020 Highlights
| Three months
ended
September 30
2020 | Three months
ended
September 30
2019 | Nine months
ended
September 30
2020 | Nine months
ended
September 30
2019 |
|
|
|
|
|
Gold ounces produced
|
33,557
|
33,036
|
98,749
|
101,041
|
Gold ounces sold1 |
30,401
|
34,200
|
96,806
|
100,100
|
|
|
|
|
|
Financial Data (in thousands of U.S. dollars) |
|
|
|
|
Gold sales1 |
57,379
|
50,154
|
167,532
|
135,944
|
Mine operating profit3 |
22,127
|
16,396
|
60,426
|
40,497
|
EBITDA2 |
20,618
|
16,536
|
63,633
|
44,667
|
Adjusted EBITDA2 |
25,620
|
22,316
|
74,429
|
56,269
|
Adjusted EBITDA margin2 |
45%
|
44%
|
44%
|
42%
|
Net income
|
5,606
|
1,928
|
14,982
|
902
|
Basic earnings per share attributable to shareholders
|
0.01
|
0.00
|
0.03
|
0.00
|
Adjusted net income2 |
10,608
|
7,708
|
25,778
|
12,504
|
Per share2 |
0.03
|
0.02
|
0.07
|
0.03
|
Cash flow from mining operations2 |
28,245
|
21,143
|
86,890
|
67,678
|
Per share2 |
0.08
|
0.06
|
0.23
|
0.18
|
Return on equity2 |
18%
|
13%
|
18%
|
13%
|
Cash on hand end of period
|
50,108
|
29,002
|
50,108
|
29,002
|
Total assets
|
327,261
|
282,089
|
327,261
|
282,089
|
|
|
|
|
|
Statistics (in dollars) |
|
|
|
|
Average realized selling price (per ounce)
|
1,887
|
1,481
|
1,731
|
1,358
|
Cash operating cost (per tonne processed)2 |
158
|
148
|
151
|
151
|
Cash operating cost (per ounce produced)2 |
615
|
510
|
589
|
499
|
Total cash cost (per ounce sold)2 |
735
|
586
|
696
|
565
|
Sustaining capital cost (per ounce sold)2 |
303
|
195
|
294
|
194
|
Site all-in sustaining cost (per ounce sold)2 |
1,037
|
781
|
990
|
760
|
All-in sustaining cost (per ounce sold)2 |
1,095
|
834
|
1,041
|
815
|
2020 Operating Outlook
-
Gold production between 120,000 and 130,000 ounces
-
Cash operating cost2 between $520 and $580/ounce
-
All-in sustaining cost2 between $930 and $990/ounce
-
Non-sustaining capital spend of $5-$10 million
-
Growth spend (includes Exploration and Séguéla study spend) of $20-$25 million
Production
Based upon Q3 production results, Roxgold is on track to deliver at the upper end of annual gold production guidance from Yaramoko.
Cash operating & All-in sustaining costs
During the quarter, there was an unfavourable impact of $104 per ounce sold to all-in sustaining costs due to COVID-19, timing of gold shipments and the higher gold price.
-
There was lower mining activity at Yaramoko as it continued to operate with reduced personnel due to COVID-19 travel restrictions and protection protocols. Throughput levels were maintained as the processing plant was supplemented with 36,201 tonnes of low-grade stockpile at an average grade of 3.1g/t processed. The cash cost impact of processing the lower grade stockpiled material was $49 per ounce sold.
-
Roxgold reported quarterly gold sales of 30,401 ounces compared to production of 33,557 ounces. Gold ounces sold were lower than production due to the timing of gold shipments at the end of the quarter with 3,320 ounces of gold doré on hand. The timing of gold shipments had a $35 per ounce sold impact on all-in sustaining costs.
-
The higher average realised gold price of $1,887 per ounce also increased royalty payments by $20 per ounce sold compared to guidance assumptions.
On a YTD basis, the cash cost impact of processing the lower grade stockpiled material is $30 per ounce sold and the higher gold price increasing royalty payments by $19 per ounce compared to guidance assumptions. Development costs for Q4 will reduce as decline development at Bagassi South was completed in September. Based on YTD performance, the Company is expecting to be at the upper end of cost guidance range due to operational impacts of managing COVID-19 related protocols.
Total mine operating expenses for the three and nine-month period include $1.3 million for COVID-19 costs, which reflects incremental costs, primarily relating to personnel, camp and transportation costs. These costs are excluded from per ounce cost metrics.
Growth spend
Growth spend has increased to $20-$25 million due to the ongoing success of the drilling program at Séguéla and Boussoura and the commencement of early works in Q4 at Séguéla. This includes a Front-End Engineering and Design study, upgrading site access through a road improvement program and some initial site works for the accommodation village. The intention of the early works activities is to enable a rapid ramp up to full construction next year with the aim of production commencing in 2022.
Response to the COVID-19 Pandemic
Management of the current global COVID-19 crisis is ongoing particularly as various jurisdictions implement measures to re-open or close again, their economies. The Company has been proactive in its response to the potential threats posed by COVID-19 and has implemented a range of measures to protect the health and well-being of its employees and host communities while continuing to operate to the extent possible, in ordinary course of business. These measures include, but not limited to, quarantine, reducing on-site crew sizes, enhanced cleaning and disinfecting protocols, requiring workers with symptoms to self isolate and promoting preventative measures including social distancing and frequent handwashing. All employees returning to site are required to complete a testing and screening process, which includes a quarantine period before they are allowed to join the active workforce. As a result, operations at Yaramoko to date have not been materially impacted by COVID-19. The Company is continually assessing the evolving situation, including the health and safety risks to the Company’s personnel and contractors at its operations and offices. Adjustments will be made as necessary to ensure the continued safety of its personnel and contractors.
Whilst production at Yaramoko has been maintained, a prolonged COVID-19 related interruption may have an impact on the Company’s operations, financial position and liquidity.
The Company has strengthened its liquidity position in the quarter with its cash and doré on hand increasing to $56.4 million and unutilised revolving credit facility totalling $20 million. In addition, the Company continues to make regularly scheduled gold shipments from the Yaramoko Gold Mine.
Mine Operating Activities
| Three months
ended
September 30
2020 | Three months
ended
September 30
2019 | Six months
ended
September 30
2020 | Six months
ended
September 30
2019 |
|
|
|
|
|
Operating Data |
|
|
|
|
Ore mined (tonnes)
|
109,767
|
131,366
|
356,762
|
339,346
|
Ore processed (tonnes)
|
131,029
|
114,036
|
384,217
|
334,718
|
Head grade (g/t)
|
7.7
|
9.1
|
8.2
|
9.3
|
Recovery (%)
|
98.2
|
98.0
|
98.2
|
98.2
|
Gold ounces produced
|
33,557
|
33,036
|
98,749
|
101,041
|
Gold ounces sold2 |
30,401
|
34,200
|
96,806
|
100,100
|
|
|
|
|
|
Financial Data (in thousands of dollars) |
|
|
|
|
Gold sales1 |
57,379
|
50,154
|
167,532
|
135,944
|
Mine operating expenses2 |
(20,240)
|
(17,519)
|
(58,659)
|
(50,241)
|
Government royalties2 |
(3,439)
|
(2,504)
|
(10,052)
|
(6,384)
|
Depreciation and depletion2 |
(11,573)
|
(11,686)
|
(38,395)
|
(35,464)
|
|
|
|
|
|
Statistics (in dollars) |
|
|
|
|
Average realized selling price (per ounce)
|
1,887
|
1,481
|
1,731
|
1,358
|
Cash operating cost (per tonne processed)2 |
158
|
148
|
151
|
151
|
Cash operating cost (per ounce produced)2 |
615
|
510
|
589
|
499
|
Total cash cost (per ounce sold)2 |
735
|
586
|
696
|
565
|
Sustaining capital cost (per ounce sold)2 |
303
|
195
|
294
|
194
|
Site all-in sustaining cost (per ounce sold)2 |
1,037
|
781
|
990
|
760
|
All-in sustaining cost (per ounce sold)2 |
1,095
|
834
|
1,041
|
815
|
Health and safety performance
Safety is a core value of Roxgold. The Company regrets to report that a Lost Time Injury (“LTI”) incident occurred in Q3 2020. The LTI was suffered by a contractor’s employee and marked the first LTI incident at Yaramoko since September 2018.
Operational performance
Mining activities totalled 109,737 tonnes of ore mined at an average mined grade of 8.9 g/t (includes marginal ore mined totalling 14,811 tonnes at a grade of 2.2 g/t) and 1,146 metres of waste development. The lower mining activity was due to Yaramoko continuing to operate with reduced personnel due to COVID-19 travel restrictions and protection protocols.
During the quarter, the 55 Zone mined 70,581 tonnes at higher grades at depth with an average mined grade of 9.9 g/t and Bagassi South mine contributed 39,185 tonnes at a grade of 7.1 g/t.
The mining tonnage was attributable to the ramping up of stoping activities at the Bagassi South mine in Q3, with stoping operations expanding as more development levels were completed offset by reduced personnel due travel restrictions associated with the COVID-19 travel restrictions and protection protocols. During Q3 2020, approximately 69% of ore produced came from stoping activities and 31% from development.
Decline development at the 55 Zone mine reached the 4714 level, approximately 600 metres below surface. Ore development continued down to 4734 level and on the eastern extensions of the 4862 and 4879 levels. The development of the Bagassi South decline reached the 5044 level and ore development commenced on the 5061 level, which is approximately 270 metres below surface. Good progress on development has seen the Bagassi South mine largely developed with decline development completed at the end of September. Ore development will continue on the 5044 level and operations will be more focussed on stoping activities in Q4 2020.
Mine reconciliation performance between the Mineral Reserve and Grade Control model was 110% for tonnes and 105% for grade in the third quarter of 2020.
The Company’s gold production in Q3 2020 was 33,557 ounces compared to 33,306 ounces in Q3 2019. The plant processed 131,029 tonnes at an average head grade of 7.7 g/t in Q3 2020 compared to 114,036 tonnes of ore at 9.1 g/t in Q3 2019. There was an increase in the processing of stockpiled material with 36,201 tonnes of low-grade stockpile at an average grade of 3.1g/t processed to supplement the mined ore as Yaramoko operated with reduced personnel due to COVID-19 travel restrictions and isolation protocols in Q3 2020.
The processing plant availability was 97.4% in the quarter compared to 93.2% in Q3 2019 and reported an average throughput rate of 1,424 tonnes per day exceeding nameplate capacity by approximately 29%. Plant recovery was 98.2% in Q3 2020 compared to 98.0% for the comparative quarter.
The Yaramoko Gold Mine continued to maintain a low cash operating cost2 of $158 per tonne processed driven by increased throughput and focus on cost control.
Financial Performance
i) Third quarter of 2020 vs third quarter of 2019
Gold sales in Q3 2020 totalled $57.4 million from 30,401 ounces of gold. The Company’s average realized gold price was $1,887 per ounce sold, 27% higher than the average realized gold price in Q3 2019.
The Company maintained a cash operating cost2 per tonne processed of $158 per tonne. The cash operating cost2 per ounce produced totalled $615 per ounce for the period compared to $148 per tonne and $510 per ounce in the comparative period.
The total cash cost2 per ounce sold of $735 in Q3 2020 was higher compared to $586 per ounce sold in Q3 2019. This was primarily impacted by the processing of lower grade stockpiled material which had an impact of $49 per ounce sold, the higher gold price in Q3 2020 which increased royalty payments by $20 per ounce sold and the commencement of the 1% contribution to the Mining fund for local development increasing royalties by $19 per ounce sold.
As a result, the Company achieved a site all-in sustaining cost2 of $1,037 per ounce sold and an all-in sustaining cost2 of $1,095 per ounce sold in the three-month period in 2020 compared to $781 per ounce and $834 per ounce sold, respectively in the comparable period. The higher all-in sustaining cost in the quarter is attributed to the higher cash cost per ounce sold including the processing of marginal ore and the timing of gold shipments which had a $35 impact on the all-in sustaining cost for Q3 2020.
The Company generated a mine operating margin2 of $1,152 per ounce in 2020 which was 28% higher than in 2019 mainly due to the higher average gold sales price.
The Company invested $5.5 million in underground mine development at the 55 Zone and $3.7 million at Bagassi South in the third quarter of 2020.
The Company generated strong cash flow from mining operations2 of $28.2 million in Q3 2020, for cash flow from mining operations per share2 of $0.08 (C$0.10/share). Comparatively, the Company generated cash flow from mining operations2 of $21.1 million and $0.06 cash flow from mining operations per share2 in Q3 2019.
ii) First nine months of 2020 vs first nine months of 2019
The Company sold 96,806 ounces of gold resulting in revenue from gold sales1 totalling $167.5 million compared to 100,100 ounces1 and $135.9 million1, respectively in the comparable period in 2019. During this period, the Company’s average realized gold price was $1,731 per ounce sold compared to an average realized gold price of $1,358 per ounce in Q3 2019.
During the nine-month period ended September 30, 2020, maintained a low cash operating cost2 per tonne processed of $151 per tonne, in line with the $151 per tonne achieved during the comparable period in 2019. The cash operating cost2 per ounce produced totalled $589 per ounce for the period compared to $499 per ounce in the prior year mainly driven by the processing of lower grade stockpiled material which had an impact of $30 per ounce sold, the higher gold price in 2020 which increased royalty payments by $19 per ounce sold and the timing of the gold shipments, which had an $11 impact on the all-in sustaining cost for 2020.
The total cash cost2 per ounce sold of $696 in nine-month ended period ended September 30, 2020 was higher compared to $565 per ounce sold in the same period in 2019. As a result, the Company achieved a site all-in sustaining cost2 of $990 per ounce sold and an all-in sustaining cost2 of $1,041 per ounce sold for YTD 2020 compared to $760 per ounce and $815 per ounce sold, respectively in the same period in 2019.
The Company has invested $17.0 million in underground development at 55 Zone and $11.5 million at Bagassi South for the nine-month period compared to $19.4 million for the comparable period in 2019. The comparable period also included $18.1 million invested in pre-commercial production underground mine development at the Bagassi South mine.
Review of Q3 2020 Financial Results
Mine operating profit
During the quarter ended September 30, 2020, revenues totalled $57.4 million (2019 - $42.3 million) while mine operating expenses and royalties totalled $20.2 million (2019 - $12.4 million) and $3.4 million (2019 - $2.1 million), respectively. The increase in sales is primarily due to a 27% increase in the average realized gold price, offset by an 11% decrease in ounces sold. Total mine operating expenses include $1.3 million COVID-19 related costs, which reflects incremental costs, primarily relating to personnel, camp and transportation costs. During the quarter, the Company achieved total cash cost2 per ounce sold of $735 and a mine operating margin2 of $1,152 per ounce sold.
During the nine-month period ended September 30, 2020, revenues totalled $167.5 million (2019 - $121.8 million) while mine operating expenses and royalties totalled $58.7 million (2019 - $40.8 million) and $10.1 million (2019 - $5.7 million), respectively. The increase in revenue is primarily due to the 27% increase in the average realized gold price. During the nine-month ended September 30, 2020, the Company achieved total cash cost2 per ounce sold of $696 and a mine operating margin2 of $1,035 per ounce sold.
For more information on the cash operating costs2 see the financial performance of the Mine Operating Activities section of this MD&A.
During the three and nine-month period ended September 30, 2020, depreciation totalled $11.6 million and $38.4 million compared to $11.3 million and $34.8 million in 2019. The increase in depreciation is a result of the Company’s continued investment in the underground development of 55 Zone and Bagassi South combined with higher throughput.
General and administrative expenses
General and administrative expenses for the three and nine-month period were $1.6 million and $4.0 million compared to $1.2 million and $3.8 million for respective periods.
Sustainability and other in-country costs
Sustainability and in-country costs totalled $0.5 million and $1.3 million for the three and nine-month ended September 30, 2020, respectively compared to $0.7 million and $1.8 million in the comparative period. The decrease in expenditures primarily relates to timing of community investments in 2020. These expenditures are incurred as part of Roxgold’s commitment to responsible operations in Burkina Faso including several sustainability and community projects.
Exploration and evaluation expenses (“E&E”)
Exploration and evaluation expenses totalled $8.1 million and $20.1 million for the three and nine-month ended September 30, 2020, respectively compared to $4.1 million and $11.4 million in the comparative period. The significant increase in exploration and evaluation activities was primarily due to the significant advancement of the feasibility study at the Séguéla Gold Project expected to be released in the first half of 2021. There was also drilling at the Boussoura project in Burkina Faso.
E&E expenses totalled $14.9 million at the Séguéla Gold Project and $5.2 million for Boussoura and Yaramoko for the nine-month end September 30, 2020. Expenditures at the Séguéla Gold Project included $8.4 million in drilling costs with $4.6 million of exploration drilling primarily at Ancien, along with $2.4 million relating to infill drilling at Boulder and Agouti and $0.9 million at Ancien. The Company has spent $2.6 million on PEA and feasibility study costs.
Drilling expenses totalled $2.5 million for YTD 2020 at the Boussoura permit.
Share-based payments
Share-based payments totalled $0.9 million and $2.9 million for the three and nine-month ended September 30, 2020, respectively compared to $0.9 million and $2.0 million in the comparative period.
Other income (expenses)
Other income (expenses) totalled $2.8 million and $8.7 million for the three and nine-month ended September 30, 2020, respectively compared to $5.2 million and $14.2 million in the comparative period. The decrease is mainly attributed to the favourable movement in foreign exchange gain of $0.9 million in Q3 2020 and $2.2 million in YTD Q3 2020.
Current and deferred income tax expense
The current income tax expense for the three and nine-month ended September 30, 2020 periods has increased with the comparable period in 2019 due to higher mine operating profits. The higher effective tax rate is also driven by the significant increase in exploration expenditures in 2020 incurred in Burkina Faso and Cote d’Ivoire not being tax effected due to the Company’s status under the mining regulations.
Net income & EBITDA
The Company’s net income was $5.6 million for the three-month ended September 30, 2020 and $15.0 million for the nine-month ended September 30, 2020 compared to net income of $1.9 million and $0.9 million respectively in the comparative 2019 period.
The Company’s EBITDA2 was $20.6 million for the three-month ended September 30, 2020 and $63.6 million for the nine-month ended September 30, 2020, respectively compared to $16.5 million and $44.7 million, respectively in the comparative 2019 period.
Net income increased significantly compared to prior period primarily as a result of higher average realized gold sales price, offset by its focus on growth with significant investments in exploration and evaluation at Séguéla and Boussoura and higher depreciation.
Income Attributable to Non-Controlling Interest
For the three and nine-month period ended September 30, 2020, the income attributable to the non-controlling (“NCI”) interest was $1.4 million and $4.0 million, respectively. The Government of Burkina Faso holds a 10% carried interest in Roxgold SANU SA and as such is considered Roxgold’s NCI. The NCI attributable income is based on IFRS accounting principles and does not reflect dividend payable to the minority shareholder of the operating legal entity in Burkina Faso.
Financial Position
As of September 30, 2020, the Company had $50.1 million in cash and cash equivalents, doré on hand of $6.3 million4 with $35.9 million of long-term debt. The restricted cash totalling $1.5 million relates to funds restricted for the purposes of future restoration costs of the Yaramoko Gold Mine. The Company’s current assets exceeds its current liabilities by $24.5 million.
With the existing cash balance and the forecasted cash flows from operations, the Company is well positioned to fund its cash requirements for the next twelve months which relate primarily to the following activities:
-
Underground development at the 55 Zone and Bagassi South
-
Exploration programs at Séguéla and Boussoura
-
Principal debt and interest repayments
The Company manages its capital structure and adjusts when necessary in accordance with its objectives and changes in economic conditions. During Q2 2020, the Company completed the refinancing of its existing credit facility by consolidating the outstanding principal amount of the original credit facility as well as the revolving credit facility into a single credit facility with an outstanding principal balance of $37.1 million.
The Company also secured an additional $20 million as a revolving credit facility to provide increased liquidity and financial flexibility.
The Company’s total assets as of September 30, 2020 has increased by $35.6 million when compared to December 31, 2019. This is mainly driven by the continuing investment in property, plant and equipment and the contract extension with AUMS at Yaramoko, offset by depreciation during the year.
Interim Reserves and Resources Estimate
Proven and Probable Mineral Reserves at Yaramoko increased 8% to 710,000 oz Au, net of mining depletion of 207,396 oz Au at an average processed head grade of 9.2 g/t, from the period of December 31, 2018 to June 30, 2020. Measured and Indicated Mineral Resources increased 4% to 857,000 oz Au from 827,000 oz Au relative to the December 31, 2018 estimate (refer to Company press release dated July 11, 2019 for further details with respect to the December 31, 2018 estimates).
The increase in Mineral Reserves and Measured and Indicated Mineral Resources is primarily attributed to the success of a prior drilling program that delineated mineralization in the near-surface portion of the 55 Zone, intersecting several high grade intervals close to surface and above zones previously mined from underground in the early stages of the 55 Zone mining operation. The objective of this drill program was to determine the potential for an open pit operation to complement the high-grade underground operation and extend the mine life at the 55 Zone (refer to Company press release dated September 30, 2020).
Inferred Mineral Resources decreased 37% from 191,000 oz Au to 121,000 oz Au as per the December 31, 2018 estimate. The decrease in the Inferred Mineral Resources is primarily due to the conversion of prior Inferred Mineral Resources to Indicated Mineral Resources with the extension of Inferred Mineral Resources to be a priority for upcoming underground drilling campaigns.
The Mineral Resources and Mineral Reserves models were prepared in conformity with The Canadian Institute of Mining, Metallurgy and Petroleum’s (CIM) Estimation of Mineral Resources and Mineral Reserves Best Practices Guidelines (November, 2019) and are classified per the CIM Definition Standards for Mineral Resources and Mineral Reserves (May, 2014).
Table 1 – Yaramoko Mineral Reserve Statement Summary
| Yaramoko June 2020 Mineral Reserve Estimate |
| Proven | Probable | Proven & Probable |
Tonnes
|
Grade
|
Metal
|
Tonnes
|
Grade
|
Metal
|
Tonnes
|
Grade
|
Metal
|
(kt)
|
(g/t Au)
|
(000 oz)
|
(kt)
|
(g/t Au)
|
(000 oz)
|
(kt)
|
(g/t Au)
|
(000 oz)
|
Stockpiles
|
131
|
3.4
|
14
|
-
|
-
|
-
|
131
|
3.4
|
14
|
55 Zone |
|
|
|
|
|
|
|
|
|
Open pit
|
-
|
-
|
-
|
820
|
7.2
|
190
|
820
|
7.2
|
190
|
Underground
|
262
|
6.0
|
51
|
1,354
|
7.2
|
314
|
1,616
|
7.0
|
365
|
Bagassi South |
|
|
|
|
|
|
|
|
|
Underground
|
-
|
-
|
-
|
576
|
7.6
|
141
|
576
|
7.6
|
141
|
Total | 393 | 5.1 | 65 | 2,750 | 7.3 | 645 | 3,143 | 7.0 | 710 |
Notes:
(1) Mineral Reserves are reported in accordance with NI 43-101 with an effective date of June 30, 2020, for the Yaramoko Gold Mine.
(2) The Yaramoko Mineral Reserves are reported on a 100% basis at a gold grade cut-off of 0.9g/t Au for the 55 Zone open pit, 3.1g/t Au for 55 Zone underground and 2.8g/t Au for Bagassi South Underground, based on a gold price of US$1,500/ounce. Reported Mineral Reserves account for mine depletion and stockpile activities as at June 30, 2020.
(3) The Yaramoko Underground Mineral Reserve Statement was prepared under the supervision of Mr. Ashraf Suryaningrat, Senior Mine Engineer at Roxgold Inc. Mr. Suryaningrat is a Qualified Person as defined in NI 43-101.
(4) The Yaramoko Open pit Mineral Reserve Statement was prepared under the supervision of Mr. David Whittle, General Manager - Yaramoko at Roxgold Inc. Mr. Whittle is a Qualified Person as defined in NI 43-101.
(5) All figures have been rounded to reflect the relative accuracy of the estimates and totals may not add due to rounding.
(6) The Yaramoko Gold Project is subject to a 10% carried interest held by the government of Burkina Faso
Table 2 – Yaramoko Mineral Resource Statement Summary
| Yaramoko June 2020 Mineral Resource Estimate |
|
| Measured | Indicated | Measured & Indicated | Inferred |
|
Tonnes
|
Grade
|
Metal
|
Tonnes
|
Grade
|
Metal
|
Tonnes
|
Grade
|
Metal
|
Tonnes
|
Grade
|
Metal
|
|
(kt)
|
(g/t Au)
|
(000 oz)
|
(kt)
|
(g/t Au)
|
(000 oz)
|
(kt)
|
(g/t Au)
|
(000 oz)
|
(kt)
|
(g/t Au)
|
(000 oz)
|
|
Stockpiles
|
131
|
3.4
|
14
|
-
|
-
|
-
|
131
|
3.4
|
14
|
-
|
-
|
-
|
|
55 Zone |
|
|
|
|
|
|
|
|
|
|
|
|
|
Open pit
|
-
|
-
|
-
|
972
|
7.7
|
240
|
972
|
7.7
|
240
|
202
|
4.4
|
29
|
|
Underground
|
220
|
9.5
|
67
|
894
|
12.4
|
356
|
1,115
|
11.8
|
423
|
178
|
8.1
|
46
|
|
Bagassi South |
|
|
|
|
|
|
|
|
|
|
|
|
|
Underground
|
-
|
-
|
-
|
436
|
12.9
|
180
|
436
|
12.8
|
180
|
176
|
8.1
|
46
|
|
Total | 351 | 7.2 | 81 | 2,303 | 10.5 | 776 | 2,654 | 10.0 | 857 | 556 | 6.8 | 121 |
|
| | | | | | | | | | | | | | | |
Notes:
(1) Mineral Resources are reported in accordance with NI 43-101 with an effective date of June 30, 2020, for the Yaramoko Gold Mine.
(2) The Yaramoko Mineral Resources are reported on a 100% basis at a gold grade cut-off of 0.5g/t Au for the 55 Zone open pit and 2.7g/t Au for underground, based on a gold price of US$1,700/ounce; with the 55 Zone open pit constrained to an MII pit optimisation shell. Reported Mineral Resources account for mine depletion and stockpile activities as at June 30, 2020.
(3) The identified Mineral Resources are classified according to the “CIM” definitions for the Measured, Indicated, and Inferred categories. The Mineral Resources are reported in situ without modifying factors applied.
(4) The Yaramoko Mineral Resource Statement was prepared under the supervision of Mr. Hans Andersen, Senior Resource Geologist at Roxgold Inc. Mr. Andersen is a Qualified Person as defined in NI 43-101.
(5) All figures have been rounded to reflect the relative accuracy of the estimates and totals may not add due to rounding.
(6) Mineral Resources that are not Mineral Reserves do not necessarily demonstrate economic viability.
(7) Mineral Resources are reported inclusive of Mineral Reserves
(8) The Yaramoko Gold Project is subject to a 10% carried interest held by the government of Burkina Faso
Exploration activities
Séguéla Gold Project
Exploration activities have continued to progress to delineate additional mineral resources within close proximity to Antenna. The current targets, including the recent discovery of Koula, along with the previously defined Agouti, Boulder and Ancien, are within 6 kilometres of the Antenna deposit (Figure 1).
Figure 1: Séguéla Location Plan
Significant progress was made on defining and extending mineralization at Boulder, Agouti and Ancien with 4 RC/diamond core rigs active throughout the third quarter of 2020, along with concluding geotechnical drilling in support of the feasibility study.
Koula
Located approximately 1km to the east of Antenna, the high grade Koula deposit was discovered through field reconnaissance and coincident recent artisanal workings in an area previously considered to be a lower exploration priority.
The positive results from the initial 10-hole RC reconnaissance program (refer to Company press release dated September 8, 2020) triggered an infill program of RC and diamond drilling to 50m centres. Three drill rigs were operating at Koula at the end of the quarter with a fourth en route with drilling to 50m centres designed to support the rapid advancement of Koula for inclusion of the prospect in the upcoming Feasibility Study.
Displaying similar characteristics to those of Ancien in terms of host geology, mineralization style, high grade tenor and coarse visible gold, Koula remains open to the south with an interpreted southerly plunge remaining to be tested beyond the currently defined 350m down-plunge extent (Figure 2). Mineralization is hosted by quartz-carbonate veining associated with a well developed mylonitic fabric within and along the interpreted margins of a tholeiitic basalt which in turn has been tightly folded. Coarse gold is commonly recorded in the higher grade zones.
Highlights of recent results include:
-
19 metres (“m”) at 26.1 grams per tonne gold (“g/t Au”) in drill hole SGRC877 from 189m including
-
2m at 23.0 g/t Au from 192m and
-
2m at 52.6 g/t Au from 195m and
-
1m at 283 g/t Au from 202m
-
12m at 32.1 g/t Au in drill hole SGRC854 from 84m including
-
4m at 92.1 g/t Au from 90m
-
8m at 14.8 g/t Au in drill hole SGRC875 from 45m including
-
2m at 46.2 g/t Au from 45m and
-
1m at 14.4 g/t Au from 50m
-
4 m at 108.9 g/t Au in drill hole SGRC919 from 32m including
-
1m at 174.5 g/t Au from 32m and
-
1m at 257.0 g/t Au from 34m
-
9m at 49.3 g/t Au in drill hole SGDD072 from 73m including
-
1m at 201.0 g/t Au from 74m
-
9m at 30.1 g/t Au in drill hole SGRD935 from 205m including
-
3m at 81.8 g/t Au from 211m
-
32m at 8.9 g/t Au in drill hole SGRC920 from 138m including
-
2m at 28.6 g/t Au from 141m and
-
3m at 31.4 g/t Au from 157m
-
18m at 8.8 g/t Au in drill hole SGRC922 from 25m including
-
2m at 49.8 g/t Au from 31m
-
25m at 7.4 g/t Au in drill hole SGRC930 from 135m including
-
2m at 43.7 g/t Au from 140m and
-
1m at 25.3 g/t Au from 143m
-
11m at 11.2 g/t Au in drill hole SGRC929 from 79m including
-
1m at 101.0 g/t Au from 86m
-
19m at 5.2 g/t Au in drill hole SGRC916 from 88m including
-
1m at 18.0 g/t Au from 92m and
-
1m at 28.8 g/t Au from 106m
Figure 2: Koula Longsection Highlights
Ancien
Infill and extension drilling continued during the quarter with two RC/ diamond core drill rigs operating, infilling and increasing the confidence of the PEA Inferred Mineral Resource. Highlight results include 15m at 10.9 g/t Au and 4m at 9.2 g/t Au from SGRD 747 and 4m at 57.7 g/t Au from SGRD 748.
Drilling to test the upper extensions of the hanging wall lode also successfully intersected several high grade intervals, including 12m at 19.8 g/t Au from SGRD761 and 11m at 8.2 g/t Au from SGRD760, extending mineralization in this area an additional 100m up-plunge and improving the understanding of key structural controls associated with high grade mineralization.
Highlights from the most recent drilling at Ancien include:
-
12 m at 19.8 g/t Au in drill hole SGRD761 from 156m including
-
1m at 52.1 g/t Au from 162m and
-
3m at 52.9 g/t Au from 164m
-
4m at 57.7 g/t Au in drill hole SGRD748 from 202m including
-
2m at 114.2 g/t Au from 202m
-
15m at 10.9 g/t Au in drill hole SGRD747 from 226m including
-
3m at 39.8 g/t Au from 238m;
and a separate interval of
-
4m at 9.2 g/t Au from 245m
-
22m at 6.5 g/t Au in drill hole SGRD740 from 187m and also
-
6m at 7.8 g/t Au from 213m
-
11m at 8.2 g/t Au in drill hole SGRC760 from 177m including
-
2m at 37.6 g/t Au from 182m
Séguéla Regional Reconnaissance
Scout RC drilling has recently been completed at Winy and will progressively work across the high priority Séguéla prospects. This testwork program is following up on the mapping and reconnaissance sampling at Séguéla which continues to emphasise the regional prospectivity of the property package with several prospects identified where rock chip samples recorded several instances of high grade visible gold (Figure 3). In addition to ongoing detailed field mapping, auger drilling is underway targeting the southern extensions of key favourable structural corridors that host the Antenna, Ancien-Boulder-Agouti, and Elephant-Winy mineralization. Follow up scout RC drilling is planned in the latter part of the year across these prospects.
*note: values are g/t Au
Figure 3: Séguéla regional reconnaissance sampling program
Boussoura Project
Located approximately 190km south of Yaramoko, RC and core drilling at the Boussoura project has led to a new high grade discovery at Galgouli, and excellent results following up historic drilling at Fofora (refer to Company press releases dated February 3 and 20, 2020 and July 29, 2020). The Boussoura project is located in the southern portion of the Houndé Greenstone Belt in southern Burkina Faso.
Figure 4: Boussoura Project Location on Houndé Belt
Fofora
Drilling resumed at Boussoura in early May after a pause to assess the potential impact of the coronavirus. The program restarted with an RC/DD rig moving to scout drilling testing three vein sets with coincident artisanal workings, geophysical and geochemical targets within 1 km west of the Fofora vein. These targets form part of the large and active 3 km by 3 km artisanal field and are very similar in appearance to the high grade Fofora vein, consisting of a series of parallel north to north-west striking quartz veins and associated shear zones with surface strike expressions of up to 1000 m.
Mineralization is typically associated with a series of sheared felsic dykes, associated quartz veining and intense silica alteration and replacement, with a variable dip from steep westerly to ~70 degrees east with coarse gold commonly seen in samples. Two mineralization styles have now been recognized at Fofora, with very broad lower grade zones (typically 0.5-1.0g/t) extending up to 60m in width and interpreted as representing siliceous alteration halos to much higher grade quartz veins (10 to >100g/t intervals with high levels of coarse gold) over 1-4m intervals.
Reconnaissance RC drilling tested vein targets up to two kilometres to the west of the main Fofora vein, with recent results including 12 m at 5.7 g/t from 74 m in BSR-20-RC-FFR-052, 26 m at 1.3 g/t Au from 0m in BSR-20-RC-FFR-053A which included 3 m at 7.1g/t Au from 14 m, and 17 m at 2.1 g/t Au from BSR-20-RC-FFR-079 from 41 m with these results increasing the extent of mineralization identified to date (refer to Company release dated September 14, 2020).
Reconnaissance drilling is continuing to test targets a further 1km west and south with further work to test the balance of the 3 km by 3 km artisanal field planned for Q4 this year, after the conclusion of the rainy season in October.
Highlights from the most recent drilling at Fofora Main include:
-
4.8 m at 26.9 g/t Au in drill hole BSR-20-RD-FFR-040 from 79.5m including
-
0.8 m at 147 g/t Au from 79.5 m, in addition to
-
1.9 m at 7.3 g/t Au from 42.7 m and
-
6.0 m at 2.5 g/t Au from 57.5 m and
-
9 m at 2.7 g/t Au from 182 m
-
9 m at 10.7 g/t Au in drill hole BSR-20-RC-FFR-063 from 71 m including
-
1 m at 84.1 g/t Au from 77 m
-
12 m at 5.7 g/t Au in drill hole BSR-20-RC-FFR-052 from 74 m including
-
2 m at 33.4 g/t Au from 74 m
-
22 m at 2.1 g/t Au in drill hole BSR-20-RC-FFR-062 from 40 m including
-
1 m at 35.4 g/t Au from 45 m
-
6.7 m at 6.4 g/t Au in drill hole BSR-19-DD-FFR-011 from 244.3 m including
-
0.4 m at 94 g/t Au from 249.6 m
-
14 m at 3.0 g/t Au in drill hole BSR-20-RC-FFR-070 from 2 m including
-
2 m at 13.5 g/t Au from 8 m
Highlights from the most recent drilling at Fofora scout drilling include:
-
12 m at 5.7 g/t Au in drill hole BSR-20-RC-FFR-052 from 74 m including
-
2 m at 33.4 g/t Au from 74m
-
15 m at 1.0 g/t Au in drill hole BSR-20-RC-FFR-051 from 54 m and
-
4 m at 6.0 g/t Au from 94m
-
30 m at 1.3 g/t Au in drill hole BSR-20-RC-FFR-053A from 0 m including
-
2 m at 10.0 g/t Au from 14 m and
-
2 m at 11.4 g/t Au from 74 m
-
8 m at 2.1 g/t Au in drill hole BSR-20-RC-FFR-060 from 16 m
-
16 m at 1.0 g/t Au in drill hole BSR-20-RC-FFR-076 from 22 m
-
17 m at 2.1 g/t Au in drill hole BSR-20-RC-FFR-079 from 41 m
Galgouli
Exploration activities at Galgouli during the quarter focussed on extending Auger drilling and soil geochemistry sampling across a 5 km by 7 km grid, extending along strike to the south east of the high grade Galgouli vein. Auger drilling is continuing, with results highlighting several elongate 1-2 km long anomalies with similar strike orientations to the north-west striking Galgouli vein, with peak results >500 ppb. These auger geochemistry results highlight the potential strike extensions of the Galgouli mineralization. This program will continue, weather depending, with follow-up scout RC drilling planned for Q4 after the end of the rainy season.
Yaramoko Exploration
A review of near-surface mineralization opportunities across the Yaramoko complex identified several prospects for further work to advance potential open-pit opportunities, including the near-surface portion of the 55 Zone, to complement the high-grade underground operation. Several other early-stage opportunities have been identified across the Yaramoko property as part of a regional targeting exercise that will be followed up over the next 12 months to assess further near-surface mineralization opportunities. A RC drilling campaign testing the extent of mineralization in the near-surface portion of the 55 Zone was completed and successfully intersected several high grade intervals close to surface and above zones previously mined from underground of the 55 Zone. (refer to Company release dated September 30, 2020).
Highlights from the RC drilling at 55 Zone include:
-
6 m at 77.2 g/t Au in drill hole YRM-19-RC-55Z-003 from 38 m including
-
1.0 m at 107 g/t Au from 39 m and
-
1.0 m at 220 g/t Au from 42 m
-
6 m at 49.5 g/t Au in drill hole YRM-19-RC-55Z-005 from 41 m
-
6 m at 7.2 g/t Au in drill hole YRM-19-RC-55Z-006 from 40 m including
-
1.0 m at 30.2 g/t Au from 41m
-
11 m at 10.1 g/t Au in drill hole YRM-19-RC-55Z-012 from 14 m
-
4 m at 16.2 g/t Au in drill hole YRM-19-RC-55Z-017 from 40 m
-
4 m at 7.5 g/t Au in drill hole YRM-19-RC-55Z-018 from 30 m
-
2 m at 29.5 g/t Au in drill hole YRM-19-RC-55Z-019 from 41 m including
-
1 m at 56.1 g/t Au from 41 m
-
3 m at 11.3 g/t Au from 35 m in drill hole YRM-19-RC-55Z-004
-
7 m at 3.6 g/t Au from 15 m in drill hole YRM-19-RC-55Z-020
-
7 m at 6.6 g/t Au from 36 m in drill hole YRM-19-RC-55Z-032
-
7 m at 5.0 g/t Au from 40 m in drill hole YRM-19-RC-55Z-034
-
6 m at 23.8 g/t Au from 13 m in drill hole YRM-19-RC-55Z-052
Conference Call and Webcast Information
The Company will host a conference call and live webcast on Wednesday, November 11th, 2020 at 8:00 am ET to discuss its financial results and business outlook.
Listeners may access a live webcast of the conference call from the events section of the Company's website at www.roxgold.com or to participate in the live conference call by dialing toll free 1 (844) 607-4367 within North America or +1 (825) 312-2266 from international locations. Registration is open through the live call, but to ensure you are connected for the full call, we suggest registering a minimum of 10 minutes before the start of the call.
An online archive of the webcast will be available by accessing the Company's website at www.roxgold.com. A telephone replay will be available for two weeks after the call by dialing toll free 1 (800) 585-8367 within North American or +1 (416) 621-4642 from international locations and entering passcode: 883 5548.
Notes:
-
For the three and nine-month period ended September 30, 2019, gold ounces sold, and gold sales include pre-commercial production ounces sold of 5,423 ounces and 10,144 ounces respectively, and revenues of $7.9 million and $14.2 million respectively. The pre-commercial production gold sales and mine operating expenses were accounted against Property, Plant and Equipment.
-
The Company provides some non-IFRS measures as supplementary information that management believes may be useful to investors to explain the Company’s financial results. Please refer to note 15 “Non-IFRS financial performance measures” of the Company’s MD&A dated November 10, 2020, available on the Company’s website at www.roxgold.com or on SEDAR at www.sedar.com for reconciliation of these measures.
-
For the three and nine-month period ended September 30, 2019, mine operating profit includes $2.0 million and $3.3 million respectively relating to Bagassi South pre-production revenue net of expenses related to the 5,423 ounces and 10,144 ounces sold respectively.
-
As at Sept 30, the Company had 3,320 ounces of gold on hand, valued at $6.3 million
Qualified Persons
Paul Criddle, FAusIMM, Chief Operating Officer for Roxgold Inc., a Qualified Person within the meaning of National Instrument 43-101, has reviewed, verified and approved the technical disclosure contained in this news release.
Paul Weedon, MAIG, Vice-President, Exploration for Roxgold Inc., a Qualified Person within the meaning of National Instrument 43-101, has verified and approved the technical disclosure contained in this news release. This includes the QA/QC, sampling, analytical and test data underlying this information. For more information on the Company’s QA/QC and sampling procedures, please refer to the Company’s Annual Information Form dated December 31, 2019, available on the Company’s website at www.roxgold.com and on SEDAR at www.sedar.com.
For further information regarding the Yaramoko Gold Mine, please refer to the technical report dated December 20, 2017, and entitled “Technical Report for the Yaramoko Gold Mine, Burkina Faso” (the “Yaramoko Technical Report”) and the technical report prepared for the Séguéla Gold Project entitled “NI 43-101 Technical Report, Séguéla Project, Preliminary Economic Assessment, Worodougou Region, Côte d’Ivoire” dated April 14, 2020 (the “Séguéla Technical Report”) and together with the Yaramoko Technical Report, the “Technical Reports” available on the Company’s website at www.roxgold.com and on SEDAR at www.sedar.com.
About Roxgold
Roxgold is a Canadian-based gold mining company with assets located in West Africa. The Company owns and operates the high-grade Yaramoko Gold Mine located on the Houndé greenstone belt in Burkina Faso and is advancing the development and exploration of the Séguéla Gold Project located in Côte d’Ivoire. Roxgold trades on the TSX under the symbol ROXG and as ROGFF on OTCQX.
This press release contains “forward-looking information” within the meaning of applicable Canadian securities laws (“forward-looking statements”). Such forward-looking statements include, without limitation: economic statements with respect to Mineral Reserves and Mineral Resource estimates (including proposals for the potential growth, extension and/or upgrade thereof and any future economic benefits which may be derived therefrom), future production and life of mine estimates, production and cost guidance, anticipated recovery grades, and potential increases in throughput, the anticipated increased proportion of mill feed coming from stoping ore, future capital and operating costs and expansion and development plans including with respect to the 55 zone and Bagassi South, and the expected timing thereof (including with respect to the delivery of ore and future stoping operations), proposed exploration plans and the timing and costs thereof, the anticipated operations, costs, proposed funding, timing and other factors set forth in the Technical Report, and sufficiency of future funding. These statements are based on information currently available to the Company and the Company provides no assurance that actual results will meet management's expectations. In certain cases, forward-looking information may be identified by such terms as "anticipates", "believes", "could", "estimates", "expects", "may", "shall", "will", or "would". Forward-looking information contained in this news release is based on certain factors and assumptions regarding, among other things, the estimation of Mineral Resources and Mineral Reserves, the realization of resource estimates and reserve estimates, gold metal prices, the timing and amount of future exploration and development expenditures, the estimation of initial and sustaining capital requirements, the estimation of labour and operating costs, the availability of necessary financing and materials to continue to explore and develop the Yaramoko Gold Project and other properties including the Séguéla Gold Project in the short and long-term, the progress of exploration and development activities as currently proposed and anticipated, the receipt of necessary regulatory approvals and permits, and assumptions with respect to currency fluctuations, environmental risks, title disputes or claims, and other similar matters, as well as assumptions set forth in the Company’s technical report dated December 20, 2017, and entitled “Technical Report for the Yaramoko Gold Mine, Burkina Faso” (the “Yaramoko Technical Report”) and the technical report prepared for the Séguéla Gold Project entitled “NI 43-101 Technical Report, Séguéla Project, Worodougou Region, Cote d’Ivoire” dated July 23, 2019 (the “Séguéla Technical Report” and together with the Yaramoko Technical Report, the “Technical Reports” available on the Company’s website at www.roxgold.com and SEDAR at www.sedar.com. While the Company considers these assumptions to be reasonable based on information currently available to it, they may prove to be incorrect.
Although the Company believes the expectations expressed in such forward-looking statements are based on reasonable assumptions, such statements are not guarantees of future performance and actual results or developments may differ materially from those in the forward-looking statements. Factors that could cause actual results to differ materially from those in forward-looking statements include: delays resulting from the COVID-19 pandemic, changes in market conditions, unsuccessful exploration results, possibility of project cost overruns or unanticipated costs and expenses, changes in the costs and timing of the development of new deposits, inaccurate reserve and resource estimates, changes in the price of gold, unanticipated changes in key management personnel, failure to obtain permits as anticipated or at all, failure of exploration and/or development activities to progress as currently anticipated or at all, and general economic conditions. Mining exploration and development is an inherently risky business. Accordingly, actual events may differ materially from those projected in the forward-looking statements. This list is not exhaustive of the factors that may affect any of the Company's forward-looking statements. These and other factors should be considered carefully and readers should not place undue reliance on the Company's forward-looking statements. The Company does not undertake to update any forward-looking statement that may be made from time to time by the Company or on its behalf, except in accordance with applicable securities laws.

View source version on businesswire.com: https://www.businesswire.com/news/home/20201110006233/en/
Contacts:
Roxgold Inc.
Graeme Jennings, CFA
Vice President, Investor Relations
416-203-6401
gjennings@roxgold.com
Source: Roxgold Inc.
© 2024 Canjex Publishing Ltd. All rights reserved.