(All financial information contained herein are expressed in US dollars unless otherwise stated)
VANCOUVER, British Columbia, June 29, 2026 (GLOBE NEWSWIRE) -- FortunaMining Corp. (NYSE: FSM | TSX: FVI) announces positive results from the feasibility study (“FS”) for its Diamba Sud Gold Project in Senegal, confirming an economically robust open-pit conventional carbon-in-leach (“CIL”) gold mine and advancing one of Fortuna’s key growth opportunities.
Jorge A. Ganoza, President and CEO of Fortuna, commented, “Diamba Sud is a standout growth project with high returns, fast payback, and is expected to be our lowest-cost mine. Together with our Séguéla mine expansion, Diamba Sud supports our plan to grow our annual gold production rate by approximately 60% to more than 500,000 ounces in 2028.” Mr. Ganoza concluded, “With the recent receipt of the environmental decree from the Senegalese government and the feasibility study complete, we are ready to move Diamba Sud toward a final investment decision upon completion of the mining permit process.”
Feasibility Study Highlights
Financial
- After-tax NPV5% of $1 billion, IRR of 60%, and 1-year payback at $3,500/oz gold
- At $4,000/oz gold, returns increase to NPV5% of $1.3 billion, IRR of 72%, and 11-month payback
Production and Cost
- Strong first 4 years: Average annual gold production of 158,000 ounces
- 9.4-year life of mine (“LOM”) with an average annual gold production of 116,000 ounces
- Low-cost profile: Average AISC1 of $1,056/oz over the first 4 years and $1,332/oz over LOM
- Final investment decision expected after receipt of the mining permit; first gold targeted by Q2 2028
CAPEX and Funding
- Total initial capital of $397.5 million
- Funding secured by the Company's strong cash flow generation and liquidity of over $800 million2
Early Works
- The Company continues advancing camp construction, office facilities and new site access road
- A letter of intent (“LOI”) has been executed with African Power Services (“APS”) as the power station engineering, procurement, and construction (“EPC”) contractor to secure the heavy-fuel oil (“HFO”) and light-fuel oil (“LFO”) generators
- Front-end engineering design (“FEED”) is being completed to support early procurement of critical-path equipment, including the SAG mill, to reduce project schedule risk
Notes:
- This is a non-IFRS financial measure. The definition and purpose of this non-IFRS financial measure is included under the heading “Cautionary Note on Non-IFRS Measures” in this news release
- Liquidity position as at March 31, 2026
DiambaSudFeasibility Study Overview
The Feasibility Study was prepared by Fortuna and supported by a team of independent industry experts, including Lycopodium, Knight Piesold, Kenmore Mine Consulting, SOJUFISC, Infinity Corporate Finance, Piteau Associates, Entech, and Earth Systems.
The Diamba Sud Gold Project is located in the Kédougou Region of southeastern Senegal, approximately 665 kilometers southeast of Dakar, 83 kilometers northeast of Kédougou, and 50 kilometers north of the Senegal-Guinea border. The Project comprises the contiguous DS1 and DS2 permit blocks, situated approximately 7 kilometers west of the Falémé River near the Senegal-Mali border.
Diamba Sud is operated by Boya S.A., a wholly owned indirect subsidiary of Fortuna. Boya holds full and unrestricted surface rights over the land covered by the exploration permit, subject to applicable mining regulations. Upon the granting of an exploitation permit, the State of Senegal will assume a 10% free-carried ownership interest in the Project.
Table 1 summarizes the key assumptions, operational parameters, economic results, and AISC values from the FS.
Table1: Feasibility Study Summary
| Metrics | Units | Results |
| Gold price | $/oz | | 3,500 | |
| Life of mine | year | | 9.4 | |
| Total ore mined1 | Mt | | 20.5 | |
| Contained gold in ore mined1 | koz | | 1,151 | |
| Strip ratio | w:o | | 6.3:1 | |
| Throughput (oxide) | Mtpa | | 2.5 | |
| Throughput (fresh) | Mtpa | | 2.0 | |
| Head grade | g/t Au | | 1.75 | |
| Recovery | % | | 91% | |
| Goldproduction | | |
| Total production over LOM | koz | | 1,053 | |
| Average annual production, LOM | koz | | 116 | |
| Average annual production, first 4 years | koz | | 158 | |
Perunitcostsover LOM |
| Total mining costs | $/t, mined | | $4.8 | |
| Processing | $/t, processed | | $16.1 | |
| G&A | $/t, processed | | $8.6 | |
| Cash costs 2 | | |
| Average operating cash costs2, LOM | $/oz | | $1,146 | |
| Average operating cash costs2, first 4 years | $/oz | | $856 | |
| AISC2 | | |
| Average AISC2, LOM | $/oz | | $1,332 | |
| Average AISC2, first 4 years | $/oz | | $1,056 | |
| Capitalcosts | | |
| Initial capital expenditure | $ M | | $398 | |
| Sustaining capital, operations + Infrastructure (includesclosurecosts) | $ M | | $79 | |
| NPV5%,pre-tax (100%project basis) | $ M | | $1,379 | |
| Pre-tax IRR | % | | 70% | |
| NPV5%,after-tax(100%projectbasis) | $ M | | $1,009 | |
| After-tax IRR | % | | 60% | |
| Payback period | years | | 1 | |
| AnnualEBITDA2 | | |
| Average EBITDA2 over LOM | $ M | | $258 | |
| Average EBITDA2 over first 4 years | $ M | | $398 | |
Notes:
- The pit optimization shells used for the Mineral Reserves were generated using a gold price of $2,900/oz.
- This is a non-IFRS financial measure. The definition and purpose of this non-IFRS financial measure is included under the heading “Cautionary Note on Non-IFRS Measures” in this news release. Non-IFRS financial measures have no standardized meaning under the International Financial Reporting Standards (IFRS) and therefore, may not be comparable to similar measures presented by other issuers.
- Average operating cash costs and average AISC represent costs for projected production for the LOM at the time of gold sales.
- The FS is presented on a 100% project basis. However, upon the granting of the exploitation permit, the State of Senegal will be entitled to a 10% free-carried interest in the Project, with the right for the State to acquire an additional contributory interest of up to 25%.
- The economic analysis was carried out using a discounted cash flow approach on a pre-tax and after-tax basis, based on a gold price of $3,500/oz.
- The IRR on total investment that is presented in the economic analysis was calculated assuming a 100% ownership in Diamba Sud.
- The NPV was calculated from the after-tax cash flow generated by the Project, based on a discounted rate of 5%.
- The FS assumes that the percentage of certain royalties and taxes payable to the State, the percentage of the investment tax credit available to Boya S.A. and the percentage payable to the social development fund will be in accordance with the provisions of the Mining Convention between Boya S.A. and the State of Senegal dated April 8, 2015. There can be no assurance that such provisions will not be renegotiated by the State as part of the exploitation permit approval process.
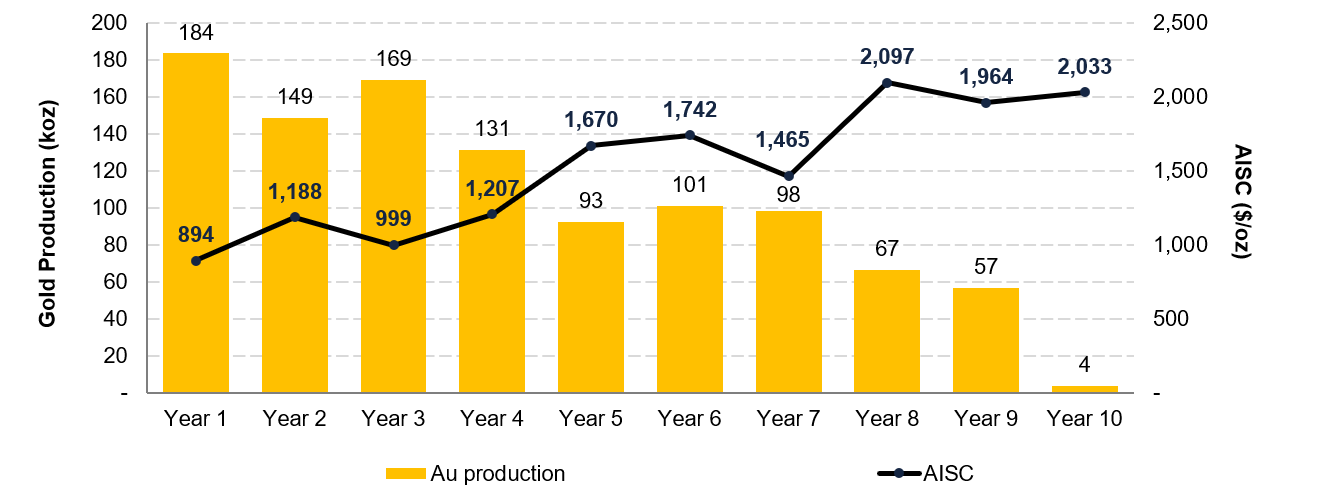
Figure 1 illustrates the Diamba Sud FS LOM production and cost profile and highlights average production of 158,000 ounces per year over the initial four years at an AISC of $1,056/oz.
Figure 1: Diamba Sud FS LOM Production and Cost Profile
Key Improvements from the 2025 PEA
The 2026 Diamba Sud FS supersedes the Preliminary Economic Assessment (“PEA”) dated October 15, 2025, and reflects a more advanced, higher-confidence project with stronger production, a longer mine life, improved technical definition, and reduced execution risk. Key optimizations to the Project include:
- Higher production profile: Average annual gold production increases from 106,000 ounces per year in the PEA to 116,000 ounces per year in the FS, including average production of 158,000 ounces per year over the first four years compared with 147,000 ounces per year over the first three years in the PEA.
- Longer mine life: Project life increases from 8.1 years in the PEA to 9.4 years in the FS, supporting an extended production and cash-flow profile.
- Reserve conversion and Resource growth: Material growth in the Indicated Mineral Resource category supports conversion to Probable Mineral Reserves, establishing a stronger foundation for the FS mine plan.
- Improved grade profile: Average feed grade increases from 1.63 g/t Au in the PEA to 1.75 g/t Au in the FS.
- Improved metallurgical performance: Metallurgical recoveries increased from 90% in the PEA to 91% in the FS.
- Higher-confidence cost and execution basis: The FS advances the Project to a level of accuracy considered consistent with an Association for the Advancement of Cost Engineering (“AACE”) Class 3 estimate, typically corresponding to an accuracy range of approximately -10% to +15%.
- Reduced execution risk: Further advancement of early works to enable a rapid construction ramp-up following FID, to secure long-lead equipment, and to protect the project’s critical-path.
Exploration Upside: Resource Growth and Continued Expansion Potential
The initial Mineral Reserve estimate for Diamba Sud (see Table 2 below) represents a major milestone and provides the foundation for a long-life, low-cost open pit operation with strong production and cash flow potential. The Probable Mineral Reserves total 20.5 million tonnes averaging 1.75 g/t Au, containing 1.15 million ounces of gold. Importantly, Diamba Sud remains open for further growth. The FS mine plan is based on the current Mineral Reserve, while additional opportunities remain to convert Mineral Resources into Mineral Reserves and to expand the resource base through continued drilling. This provides Fortuna with a clear pathway to potentially extend mine life, enhance future production, and increase the overall value of the Project.
The Mineral Reserve estimate is supported by FS-level technical work, including metallurgical, geotechnical, hydrogeological, environmental, mine planning, processing, infrastructure, and cost studies. Mineral Reserves are reported at the point of delivery to the process plant using the 2014 CIM Definition Standards, on a 100% basis, and are classified as Probable Mineral Reserves. Mineral Reserves are estimated and reported as at April 10, 2026, and are summarized in Table 2. Mineral Resources, reported exclusive of Mineral Reserves, are summarized in Table 3.
Table 2: Mineral Reserve Estimate
| Classification | Deposit | Tonnes (kt) | Au (g/t) | Au (koz) |
| Probable Mineral Reserves | Area A | 4,136 | 1.59 | 211 |
| | Area D | 5,103 | 1.70 | 279 |
| | Karakara | 2,859 | 1.87 | 172 |
| | Kassasoko | 1,164 | 0.96 | 36 |
| | Moungoundi | 1,069 | 1.10 | 38 |
| | Southern Arc | 4,464 | 2.31 | 332 |
| | Western Splay | 1,706 | 1.51 | 83 |
| Total | | 20,500 | 1.75 | 1,151 |
Table 3: Mineral Resource Estimate, exclusive of Mineral Reserves
| Classification | Deposit | Tonnes (kt) | Au (g/t) | Au (koz) |
| Indicated Mineral Resources | Area A | 288 | 0.50 | 5 |
| | Area D | 436 | 0.53 | 8 |
| | Karakara | 221 | 0.61 | 4 |
| | Kassasoko | 206 | 0.49 | 3 |
| | Moungoundi | 279 | 0.75 | 7 |
| | Southern Arc | 1,701 | 1.62 | 89 |
| | Western Splay | 233 | 0.74 | 6 |
| Total | | 3,364 | 1.12 | 121 |
| Inferred | Area A | 152 | 1.45 | 7 |
| | Area D | 264 | 0.95 | 8 |
| | Karakara | 26 | 1.47 | 1 |
| | Kassasoko | 138 | 0.86 | 4 |
| | Moungoundi | 107 | 1.09 | 4 |
| | Southern Arc | 734 | 1.42 | 33 |
| | Western Splay | 211 | 1.64 | 11 |
| Total | | 1,632 | 1.30 | 68 |
Notes:
- Mineral Reserves and Mineral Resources are as defined by the 2014 CIM Definition Standards for Mineral Resources and Mineral Reserves.
- Mineral Resources are exclusive of Mineral Reserves.
- Mineral Resources that are not Mineral Reserves do not have demonstrated economic viability.
- Factors that could materially affect the reported Mineral Resources or Mineral Reserves include; changes in metal price and exchange rate assumptions; changes in local interpretations of mineralization; changes to assumed metallurgical recoveries, mining dilution and recovery; and assumptions as to the continued ability to access the site, retain mineral and surface rights titles, maintain environmental and other regulatory permits, and maintain the social license to operate. Boya SA has applied for an exploitation permit for the Project, and if not granted, it will have a material impact on the potential development of the Project.
- Mineral Resources and Reserves for the Diamba Sud are estimated and reported as at April 10, 2026. The State of Senegal will assume a 10% free-carried ownership interest in the Project when an exploitation permit is granted and may elect to purchase up to an additional 25% contributory interest in Boya SA at a “fair price” as determined through an independent valuation.
- Mineral Reserves for the Diamba Sud Project are reported at the point of delivery to the process plant on a 100% ownership basis and have been estimated using incremental gold cutoff grades for open-pit oxide and transitional material as follows: 0.38 g/t Au for Area A, Moungoundi, and Western Splay; 0.37 g/t Au for Kassasoko and Southern Arc; 0.36 g/t Au for Karakara; and 0.35 g/t Au for Area D. For fresh material, the applied cut-off grades are 0.40 g/t Au for Karakara and Kassasoko, 0.42 g/t Au for Area A, 0.43 g/t Au for Southern Arc, 0.45 g/t Au for Moungoundi, 0.46 g/t Au for Area D, and 0.49 g/t Au for the Western Splay deposit. The cutoff grades were derived using a gold price assumption of $2,900/oz, metallurgical recovery rates ranging from 72% to 97% depending on grade and material type by deposit, and surface mining costs of $5.77/t for Area A, $5.26/t for Area D, $5.28/t for Karakara, $6.27/t for Western Splay, $6.09/t for Kassasoko, $6.18/t for Moungoundi, and $6.27/t for Southern Arc. Average processing and general and administrative (G&A) costs are estimated at $24.92/t milled for oxide and transitional material and $30.23/t for fresh material. Refining and selling costs are estimated at $5.50/oz of gold, with an applicable royalty rate of 3.5%. Pit slope angles of 32° for weathered material and 46° for fresh rock have been applied in the pit optimization. Metallurgical recoveries have been estimated using grade–recovery relationship models developed for oxide and transitional material across all deposits, with deposit-specific recovery models applied to fresh rock across the seven deposits.
- Mineral Resources are reported insitu and constrained within pit shells using selective mining unit block sizes and at an incremental gold cutoff grade for oxide/transitional material of 0.26 g/t Au, with fresh material reported based on a cutoff of 0.29 g/t Au for Area A, 0.37 g/t Au for Area D, 0.31 g/t Au for Karakara, 0.33 g/t Au for Western Splay, 0.28 g/t Au for Kassassoko, 0.31 g/t Au for Southern Arc, and 0.33 g/t Au for Moungoundi. Mineral Resource estimates are based on the same parameters used for Mineral Reserve estimates except gold price, where $3,300/oz was applied.
- Eric Chapman is the Qualified Person responsible for Mineral Resources, and is a full-time employee of Fortuna, Raul Espinoza is the Qualified Person responsible for Mineral Reserves, and is a full-time employee of Fortuna.
- Totals may not add due to rounding procedures.
Since 2023, Fortuna has invested meaningfully in mineral exploration at Diamba Sud, with the growth reflected in the maiden Mineral Reserve estimate summarized in Table 2. This work has increased both the scale and confidence of the resource base and supports the feasibility study mine plan. The Project retains further upside, particularly at Southern Arc, where recent drilling indicates the potential to extend mineralization.
Ongoing drilling is expected to test open extensions, improve geological confidence in areas currently classified as Inferred Resources, and identify additional mineralization beyond the current feasibility study mine plan. This work provides a clear pathway to further expand and upgrade the resource base, with the potential to support future mine life extensions and additional value creation.
MiningandProcessing
The FS outlines a conventional open pit gold mining operation feeding a central processing facility over a 9.4-year project life. The mine plan incorporates the Area A, Area D, Karakara, Kassassoko, Moungoudi, Southern Arc, and Western Splay deposits, with mining sequenced to support a consistent production profile over the LOM. The proposed general arrangement of the site infrastructure is shown in Figure 2.
The pit optimization shells used to constrain the Mineral Reserve were generated using a gold price of $2,900/oz and a revenue factor of 1.0. Optimization parameters included government royalties, refining, mining, processing, and general and administrative costs to support realistic pit designs and economic assumptions.
Based on the Mineral Reserve estimate, the mine plan includes the mining of 20.5 million tonnes of ore at an average gold grade of 1.75 g/t, containing 1.15 million ounces of gold. A total of 130 million tonnes of waste will be mined, resulting in a LOM strip ratio of 6.3:1.
Mining will use conventional open pit methods, including drilling and blasting for both oxide and fresh ore, followed by truck-and-shovel mining operations. Ore from the open pits will be processed through a conventional CIL plant designed to produce gold doré, incorporating crushing, milling, gravity recovery, CIL processing, carbon elution, and gold recovery.
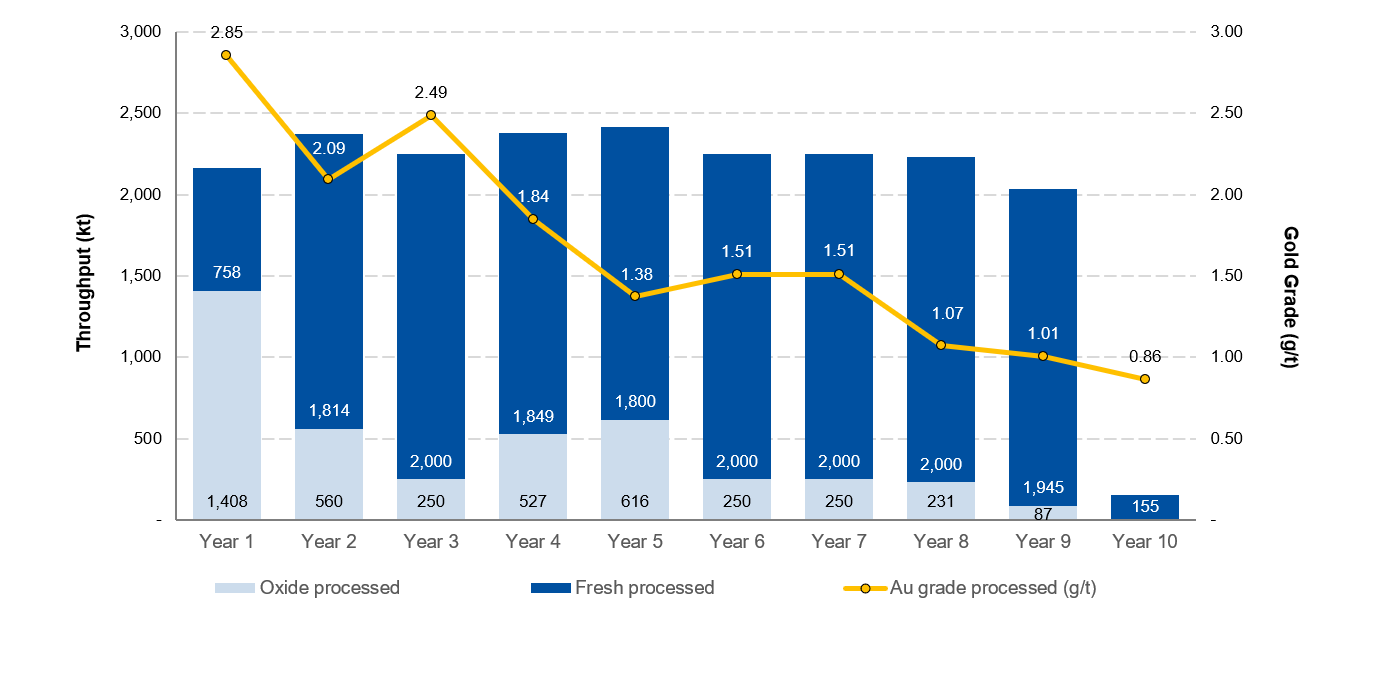
The process plant is designed to treat the ore at an average annual processing rate of approximately 2.26 million tonnes, as shown in Figure 3, producing 1.05 million ounces of gold at a LOM metallurgical recovery of 91%.
Figure 2: Diamba Sud Mine General Site Infrastructure General Arrangement
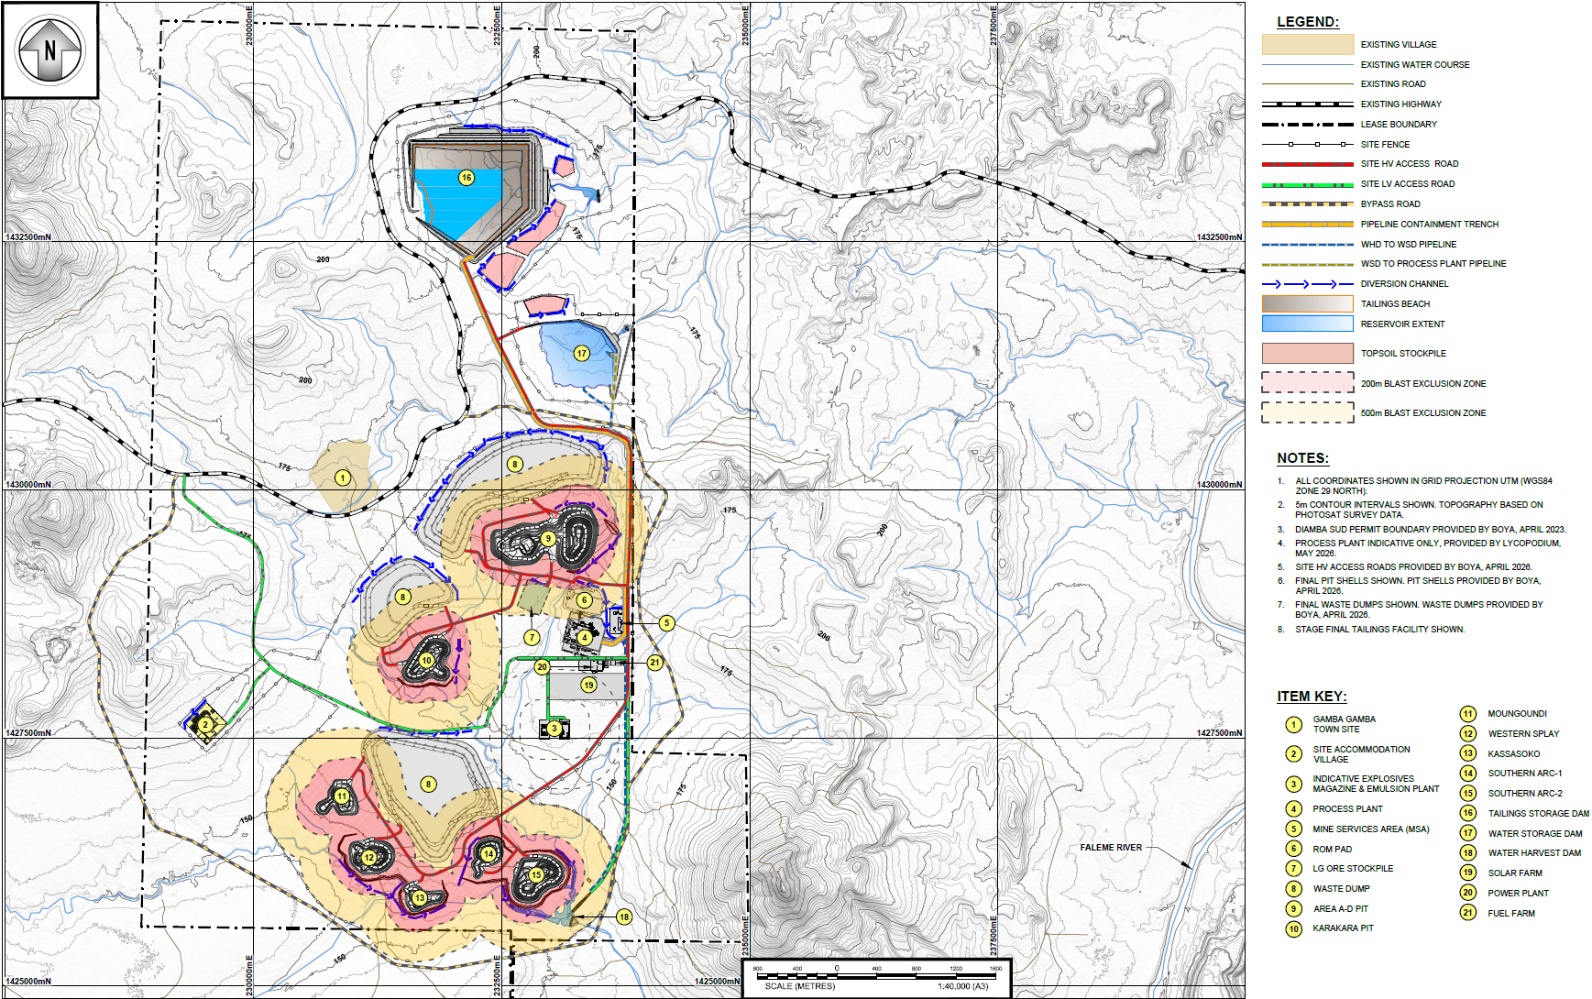
Figure 3: Diamba Sud FS LOM processing schedule
A summary of the key operating and production statistics from the FS is presented in Table 4. The Area A and D deposits are combined for planning purposes as they are to be mined from a single contiguous pit.
Table4: Diamba Sud LOM Mining and Processing Plan Metrics
| | Y0 | Y1 | Y2 | Y3 | Y4 | Y5 | Y6 | Y7 | Y8 | Y9 | Y10 | LOM |
| Area AD | | | | | | | | | | | | |
| Ore mined (kt) | 81 | 1,825 | 284 | 16 | 1,034 | 2,393 | 1,515 | 2,090 | - | - | - | 9,239 |
| Au grade (g/t) | 0.84 | 2.39 | 2.31 | 1.14 | 1.25 | 1.32 | 1.93 | 1.32 | - | - | - | 1.65 |
| Karakara | | | | | | | | | | | | |
| Ore mined (kt) | - | - | 30 | 819 | 1,972 | 37 | - | - | - | - | - | 2,859 |
| Au grade (g/t) | - | - | 1.24 | 2.04 | 1.79 | 2.85 | - | - | - | - | - | 1.87 |
| Kassasoko | | | | | | | | | | | | |
| Ore mined (kt) | - | - | - | - | - | - | 25 | 82 | 136 | 922 | - | 1,164 |
| Au grade (g/t) | - | - | - | - | - | - | 0.99 | 0.70 | 0.87 | 0.99 | - | 0.96 |
| Moungoudi | | | | | | | | | | | | |
| Ore mined (kt) | - | - | - | - | - | - | - | - | 97 | 923 | 49 | 1,069 |
| Au grade (g/t) | - | - | - | - | - | - | - | - | 0.95 | 1.10 | 1.49 | 1.10 |
| South Arc | | | | | | | | | | | | |
| Ore mined (kt) | 234 | 1,348 | 1,321 | 1,561 | - | - | - | - | - | - | - | 4,464 |
| Au grade (g/t) | 1.72 | 1.95 | 2.50 | 2.56 | - | - | - | - | - | - | - | 2.32 |
| Western Splay | | | | | | | | | | | | |
| Ore mined (kt) | - | - | - | - | - | - | 59 | 767 | 879 | - | - | 1,706 |
| Au grade (g/t) | - | - | - | - | - | - | 1.08 | 1.29 | 1.73 | - | - | 1.51 |
| Total | | | | | | | | | | | | |
| Ore mined (kt) | 315 | 3,173 | 1,635 | 2,396 | 3,006 | 2,430 | 1,599 | 2,939 | 1,112 | 1,845 | 49 | 20,500 |
| Au grade (g/t) | 1.50 | 2.21 | 2.45 | 2.37 | 1.61 | 1.34 | 1.88 | 1.30 | 1.56 | 1.04 | 1.49 | 1.75 |
| Contained gold (koz) | 15 | 225 | 129 | 183 | 155 | 105 | 97 | 123 | 56 | 62 | 2 | 1,151 |
| Waste mined (kt) | 3,644 | 15,439 | 16,606 | 16,259 | 16,020 | 16,612 | 17,438 | 12,664 | 8,114 | 6,768 | 53 | 129,618 |
| Total mined (kt) | 3,959 | 18,612 | 18,242 | 18,656 | 19,027 | 19,042 | 19,037 | 15,603 | 9,226 | 8,613 | 102 | 150,118 |
| Stockpile | | | | | | | | | | | | |
| End of period (kt) | 315 | 1,322 | 584 | 730 | 1,360 | 1,373 | 722 | 1,412 | 292 | 106 | - | n/a |
| Grade (g/t) | 1.5 | 0.98 | 0.57 | 0.57 | 0.64 | 0.58 | 0.58 | 0.59 | 0.60 | 0.57 | - | n/a |
| Processing | | | | | | | | | | | | |
| Material milled (kt) | - | 2,166 | 2,374 | 2,250 | 2,376 | 2,416 | 2,250 | 2,250 | 2,231 | 2,031 | 155 | 20,500 |
| Head grade (g/t) | - | 2.85 | 2.09 | 2.49 | 1.84 | 1.38 | 1.51 | 1.51 | 1.07 | 1.01 | 0.86 | 1.75 |
| Contained gold (koz) | - | 199 | 160 | 180 | 141 | 107 | 109 | 109 | 77 | 66 | 4 | 1,151 |
| Recovery (%) | - | 93 | 93 | 94 | 93 | 87 | 93 | 90 | 86 | 87 | 86 | 91 |
| Gold production (koz) | - | 184 | 149 | 169 | 131 | 93 | 101 | 98 | 67 | 57 | 4 | 1,053 |
Totals may not add due to rounding
Tailings,Water,andPower
The FS incorporates a fully geomembrane-lined tailings storage facility (“TSF”) designed in accordance with industry best practices and the Global Industry Standard on Tailings Management (“GISTM”). The tailings management system will include a tailings pipeline and a water return pipeline housed within a geomembrane-lined trench, together with associated tailings pumps. The TSF will be developed as a side-valley facility formed by robust, multi-zoned earth-fill embankments and constructed using the downstream methodology. It is designed to accommodate 20.5 million tonnes over the LOM.
Water management has been designed to maximize recycling and minimize environmental impacts on surrounding communities. A water storage dam (“WSD”) will serve as the main collection and storage facility for clean, raw, and process water. Raw water will be supplied by pipeline from the water harvesting dam (“WHD”) and supplemented by pit dewatering activities. Process water from the tailings storage facility will be recycled back to the process plant, with site operations designed as a closed-circuit system to maximize water reuse.
Power will be supplied through an integrated hybrid power solution comprising HFO, solar photovoltaic (“PV”), and battery energy storage system (“BESS”) components. The HFO power generation component has been agreed with African Power Services with solar integration targeted during the first year of operations.
CapitalCostsSummary
The FS estimates total initial capital required to develop Diamba Sud at $397.5 million, including $72.1 million in pre-production costs and $33.7 million in contingency. Sustaining capital is estimated at $64.0 million over the 9.4-year LOM, with closure costs estimated at an additional $14.5 million.
Pre-production mining capital includes all mining activities required prior to commissioning of the processing facility. This includes the mining of 3.6 million tonnes of waste and 315,000 tonnes of ore to establish an ore stockpile ahead of processing operations, as well as contractor mobilization and setup costs.
The processing plant capital estimate is based on a facility with a nameplate fresh ore throughput of 2.0 million tonnes per annum (“Mtpa”), designed to accommodate up to 2.5 Mtpa with an oxide blend. The capital cost estimate assumes an Engineering, Procurement, Construction, and Management (“EPCM”) implementation approach.
A summary of estimated capital costs is presented in Table 5 and estimated annual sustaining capital costs are presented in Table 6.
Table5: Summary of Initial Development Capital Costs
| CapitalCosts | Value($M) |
| Construction costs | 284.6 |
| Pre-production costs (excluding mining) | 37.7 |
| Mining pre-stripping | 34.4 |
| Contingency | 33.7 |
| Withholding taxes, duties, levies | 7.0 |
| Total | 397.5 |
Totals may not add due to rounding
Table6: Estimated Annual Sustaining Capital Costs
| Project | Y1 | Y2 | Y3 | Y4 | Y5 | Y6 | Y7 | Y8 | Y9 | Y10 | Total |
| TSF lifts ($ M) | 10.7 | - | 8.1 | - | 8.8 | - | 3.8 | - | - | - | 31.5 |
| Aerodrome ($ M) | 5.0 | - | - | - | - | - | - | - | - | - | 5.0 |
| Roads ($ M) | - | 1.7 | 0.5 | - | 0.7 | - | 0.4 | - | - | - | 3.3 |
| Surface water management ($ M) | - | 0.4 | 0.8 | - | 0.9 | - | - | - | - | - | 2.1 |
| PV + BESS ($ M) | 16.4 | - | - | - | - | - | - | - | - | - | 16.4 |
| Fuel farm ($ M) | 0.8 | 0.8 | 0.8 | 0.8 | 0.8 | 0.8 | 0.8 | - | - | - | 5.8 |
| Total ($ M) | 32.9 | 2.9 | 10.2 | 0.8 | 11.2 | 0.8 | 5.1 | - | - | - | 64.0 |
Totals may not add due to rounding
The FS capital estimate reflects a materially more advanced basis of estimate compared to the PEA, supported by a higher level of engineering definition. Key quantities and bills of quantities for major scopes, including steelwork, concrete, and overland piping, are now derived from 3D models, while major mechanical equipment pricing is supported by quotation-based inputs.
The increase in capital costs compared to the PEA reflects several factors, including the incorporation of local content requirements and Senegalese regulations as well as higher material quantities derived from the more advanced engineering and additional ground improvement requirements. The increase also reflects scope growth associated with the expanded resource base, including increased tailings storage and infrastructure requirements, additional pre-stripping, haulage roads, and water management related to bringing Southern Arc forward in the mine plan.
OperatingCost Estimates Summary
The FS estimates direct operating costs of $58.86/t of material milled, or $1,146/oz of gold produced, and LOM AISC1 of $1,332/oz, as summarized in Table 7.
Table7: LOM AISC1 Estimate
| | $ M | $/tmilled | $/payableoz |
| Operatingcost | | | |
| Mining | 699 | 34.703 | 664 |
| Processing | 330 | 16.09 | 313 |
| G&A | 177 | 8.65 | 168 |
| Subtotal,directoperatingcosts | 1,207 | 58.86 | 1,146 |
| Refining | 3 | 0.15 | 3 |
| Royalties2 | 111 | 5.39 | 105 |
| Social development fund2 | 18 | 0.90 | 18 |
| Totaloperatingcosts | 1,339 | 65.30 | 1,272 |
| Sustainingcapitalandreclamation | | | |
| Sustaining Capital | 64 | 3.12 | 61 |
| All-inSustainingCost1 | 1,403 | 68.42 | 1,332 |
Notes:
- AISC per payable ounce of gold sold are non-IFRS financial measures; refer to “Cautionary Note on Non-IFRS Measures”.
- The FS assumes a 3% royalty payable to the State and 0.5% contribution to a social development fund in accordance with the provisions of the Mining Convention between Boya S.A. and the State of Senegal dated April 8, 2015. There can be no assurance that such provisions will not be renegotiated by the State as part of the exploitation permit approval process.
- Per ore tonne mined.
FinancialAnalysis
Diamba Sud has been evaluated using a discounted cash flow analysis. The base case, using a gold price of $3,500/oz, generates an after-tax NPV5% of $1.0 billion, an IRR of 60%, and a payback period of approximately 12 months.
Table 8 illustrates the estimated LOM cash flow profile for Diamba Sud reported by calendar year based on first gold pour in June 2028 on both a pre-tax and post-tax basis. Pre-tax cash flows include royalties, duties, and levies, while post-tax cash flows are net of corporate income taxes.
Table 8: Diamba Sud LOM Cash Flow Profile, Pre-Tax and Post-Tax
| | | 2026 | 2027 | 2028 | 2029 | 2030 | 2031 | 2032 | 2033 | 2034 | 2035 | 2036 | 2037 | LOM |
| Net Au recovered | koz | - | - | 88 | 179 | 177 | 125 | 125 | 73 | 123 | 66 | 68 | 29 | |
| Revenue & OPEX by department | | | | | | | | | | | | | | |
| Gold sales | $ M | - | - | 308 | 627 | 620 | 438 | 438 | 256 | 431 | 228 | 238 | 104 | 3,684 |
| Mining costs | $ M | - | - | -54 | -85 | -90 | -86 | -92 | -81 | -94 | -51 | -47 | -19 | -699 |
| Processing costs | $ M | - | - | -20 | -37 | -36 | -36 | -37 | -37 | -37 | -37 | -36 | -17 | -330 |
| General & administration costs | $ M | - | - | -12 | -20 | -20 | -20 | -20 | -20 | -20 | -20 | -17 | -7 | -177 |
| Transport, insurance and refining costs | $ M | - | - | -0 | -1 | -1 | -0 | -0 | - | - | - | - | - | -3 |
| Royalties & statutory costs | $ M | - | - | -11 | -22 | -22 | -15 | -15 | -9 | -15 | -8 | -8 | -4 | -129 |
| Unit Costs - Per Oz Au | | | | | | | | | | | | | | |
| AISC | $/oz Au | - | - | 980 | 1,001 | 984 | 1,330 | 1,233 | 2,297 | 1,292 | 2,062 | 1,948 | 1,683 | 1,332 |
| Profitability | | | | | | | | | | | | | | |
| Net revenue | $ M | - | - | 297 | 605 | 598 | 422 | 422 | 247 | 415 | 220 | 230 | 100 | 3,555 |
| Total site operating expenses | $ M | - | - | -57 | -142 | -145 | -146 | -132 | -153 | -141 | -126 | -124 | -45 | -1,210 |
| EBITDA | $ M | - | - | 240 | 463 | 452 | 276 | 291 | 94 | 275 | 94 | 106 | 55 | 2,346 |
| Project Cashflows (Post tax, Pre- finance) | | | | | | | | | | | | | | |
| Net revenue | $ M | - | - | 297 | 605 | 598 | 422 | 422 | 247 | 415 | 220 | 230 | 100 | 3,555 |
| OPEX | $ M | - | - | -86 | -142 | -147 | -142 | -149 | -138 | -152 | -108 | -100 | -44 | 1,210 |
| Tax paid | $ M | - | - | - | -32 | -104 | -120 | -68 | -68 | -12 | -64 | -10 | -14 | -491 |
| CAPEX | $ M | -95 | -189 | -113 | - | - | - | - | - | - | - | - | - | -398 |
| Sustaining & closure capital | $ M | - | - | -28 | -16 | -8 | -5 | -8 | -6 | -4 | -3 | -1 | 0 | -79 |
| Cash Flow | | | | | | | | | | | | | | |
| Pre-tax (project) | $ M | -95 | -189 | 70 | 446 | 442 | 274 | 265 | 102 | 260 | 108 | 129 | 56 | 1,870 |
| After-tax (project) | $ M | -95 | -189 | 70 | 414 | 339 | 155 | 198 | 34 | 248 | 44 | 120 | 43 | 1,379 |
| Cumulative after-tax | $ M | -95 | -284 | -215 | 200 | 538 | 693 | 891 | 925 | 1,173 | 1,216 | 1,336 | 1,379 | 1,379 |
Totals may not add due to rounding
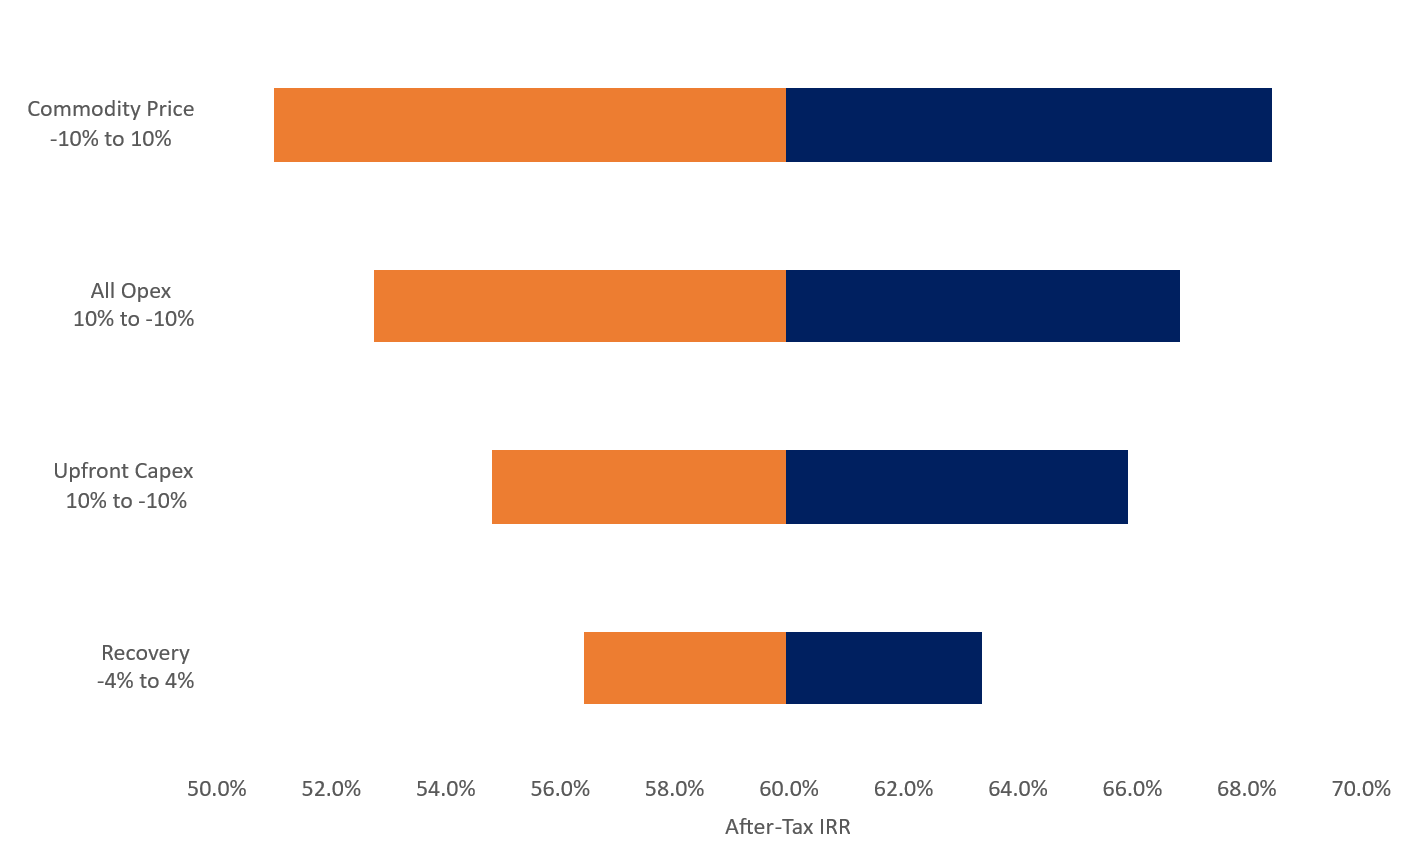
SensitivityAnalysis:StrongEconomicPerformanceAcrossaRangeofKeyVariables
A sensitivity analysis was completed to evaluate the impact of changes in key operating and economic variables, including gold price, head grade, metallurgical recovery, capital costs, and operating costs.
The analysis shows that Diamba Sud’s net present value (“NPV”) and internal rate of return (“IRR”) are most sensitive to revenue-related variables, including gold price, head grade, and process plant recovery. The Project is also more sensitive to changes in operating costs than capital costs.
Estimated NPV sensitivities for key operating and economic variables are presented in Figure 6.
Figure 6: After-Tax NPV5% Sensitivities
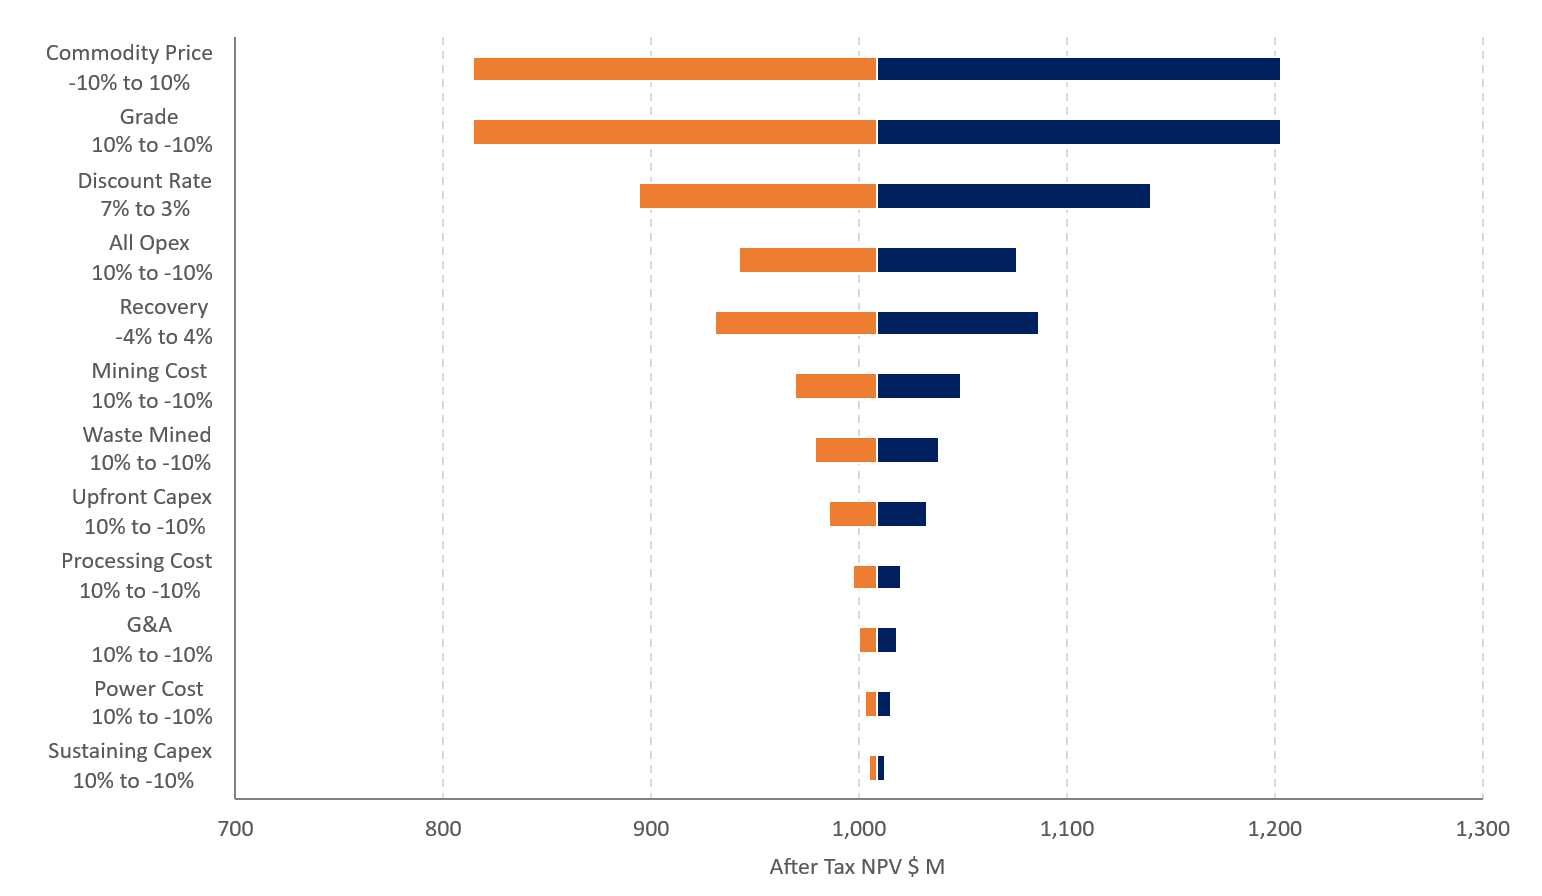
Table 9 presents the sensitivity of NPV and IRR to changes in gold price, with the base case highlighted.
Table9: After-Tax NPV5% and IRR Sensitivities to Gold Price
| | Gold Price ($/oz) |
| $2,500 | $2,750 | $3,000 | $3,250 | $3,500 | $3,750 | $4,000 | $4,250 | $4,500 |
| Sensitivity | NPV5%
($ M) | $442 | $587 | $731 | $870 | $1,009 | $1,148 | $1,287 | $1,426 | $1,565 |
IRR
(%) | | 33 | | 40 | | 47 | | 54 | | 60 | | 66 | | 72 | | 78 | | 83 |
Figure 7 presents IRR sensitivity to changes in the key operating parameters.
Figure7: Diamba Sud After-Tax IRR Sensitivities, Base Case of 60%
EnvironmentalandPermitting
Fortuna continues to advance the permitting process for Diamba Sud in Senegal. On October 7, 2025, the Company filed the Environmental and Social Impact Assessment (“ESIA”) with the Direction de la Réglementation Environnementale et du Contrôle, a division of Senegal’s Ministry of the Environment and Sustainable Development.
On February 4, 2026, Fortuna submitted an application for an exploitation permit for Diamba Sud to Senegal’s Ministry of Energy, Petroleum, and Mines. The Certificate of Conformity for the ESIA was received on June 11, 2026, representing a key milestone in the permitting process and further advancing Diamba Sud toward a potential final investment decision in mid-year 2026.
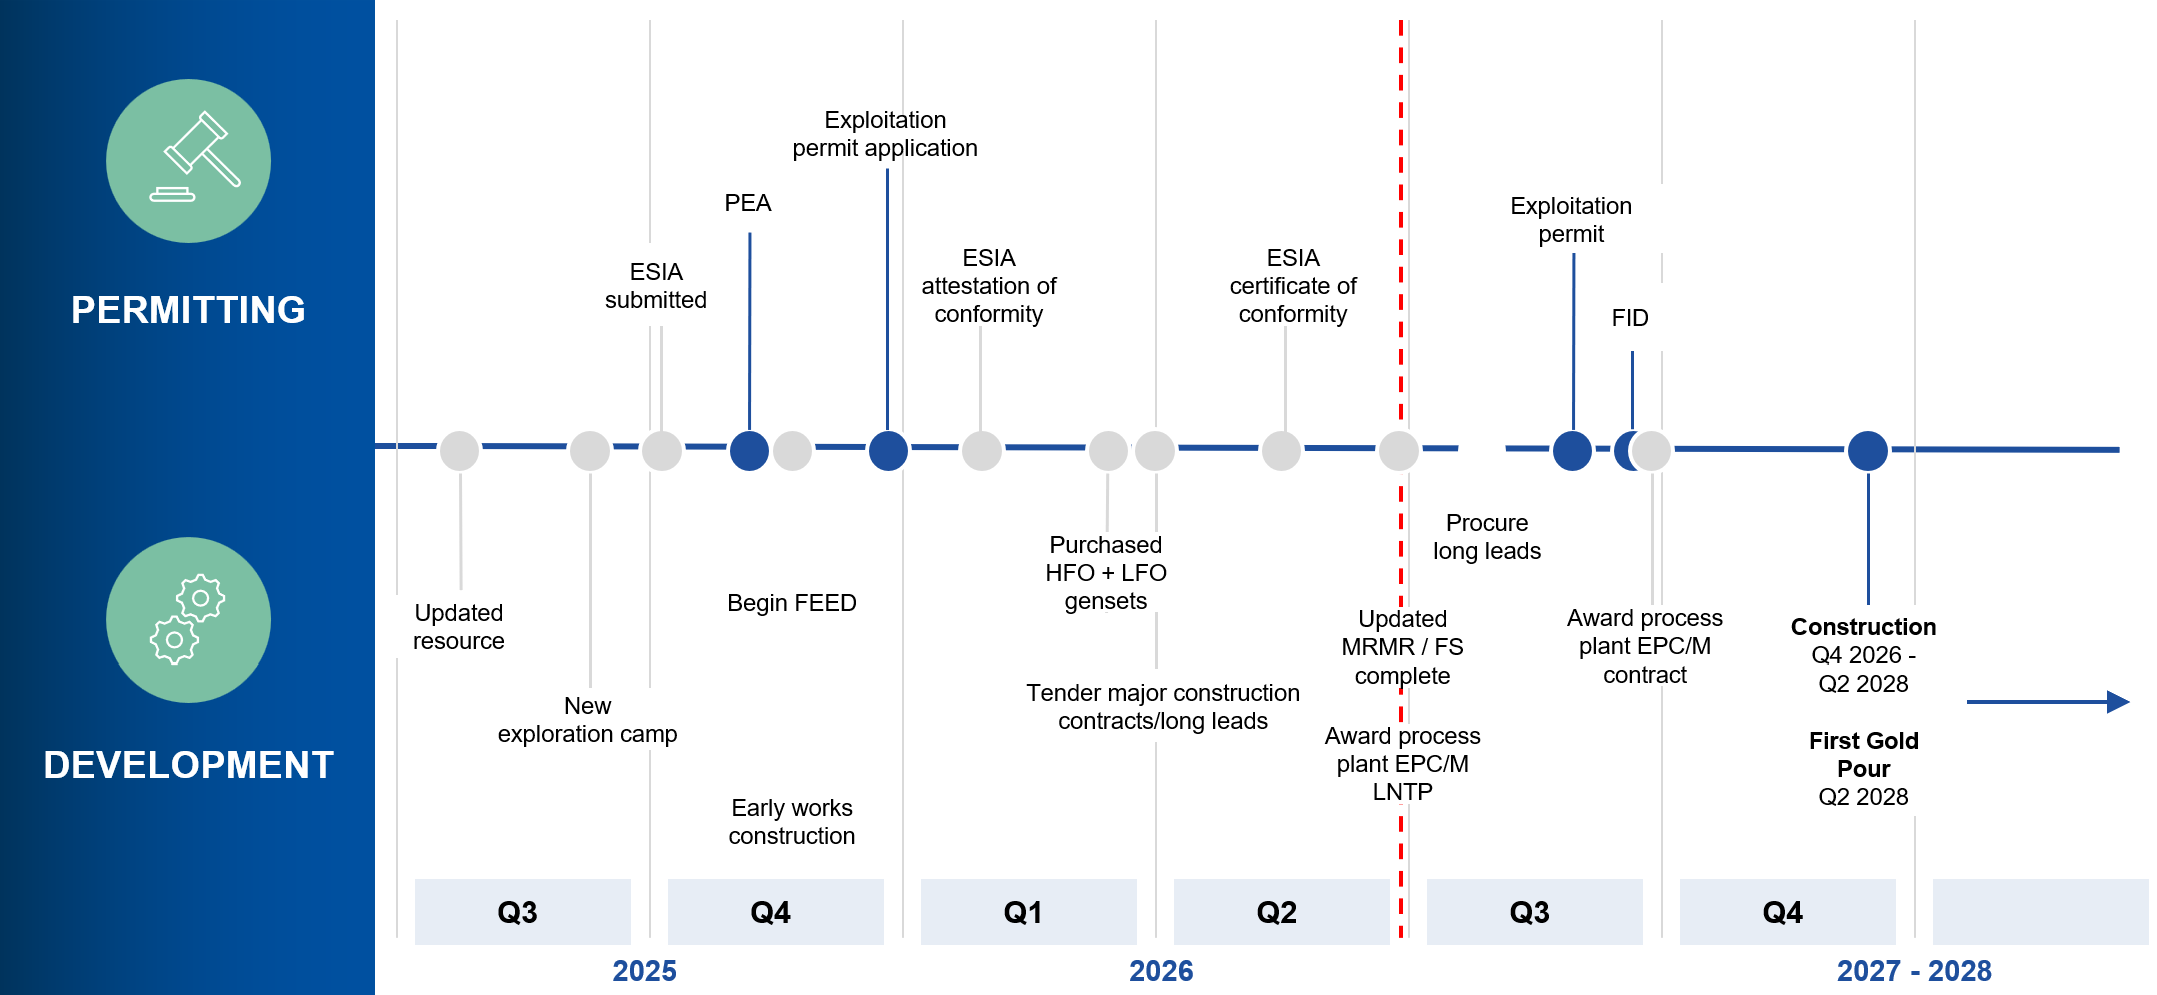
Next Steps: Early Works, Permitting, and Final Investment Decision
Fortuna has approved an early works budget of $73 million to de-risk Diamba Sud’s development schedule and advance site readiness alongside permitting and preparation for a final investment decision. Early works are progressing, including the site access road and camp expansion, while tenders for key infrastructure packages, including the TSF, are also advancing.
Front-end engineering and design and other detailed design studies are well advanced in support of project execution planning. This work is focused on long-lead items and critical-path activities, allowing selected orders to be placed as early as the third quarter of 2026. The power plant HFO and LFO generators have already been secured, with site delivery expected mid-2027. Of the approved $73 million early works budget, approximately $18 million has been spent to date.
With the FS now complete, Fortuna is well positioned to advance Diamba Sud toward a final investment decision, subject to the receipt of the required permitting approvals. The tender process for the processing plant contract is under evaluation, with a notice of award expected later this month. A positive final investment decision would position Diamba Sud to begin full construction in the fourth quarter of 2026, following the wet season, with first gold pour targeted before the end of the second quarter of 2028.
Beyond the FS base case, Diamba Sud retains meaningful upside through continued exploration, resource conversion, and project optimization. Ongoing drilling is expected to test extensions to known deposits, upgrade Inferred Mineral Resources, and evaluate opportunities to convert additional resources into Mineral Reserves. Further optimization opportunities may also be assessed through detailed engineering, mine sequencing, procurement, and operating cost refinement as the Project advances toward a final investment decision and construction.
The projected development timeline and key milestones are illustrated in Figure 8.
Figure8: Diamba Sud Projected Development Timeline and Key Milestones
TechnicalReport
A technical report supporting the results of the FS will be prepared in accordance with National Instrument 43-101, Standards of Disclosure for Mineral Projects and filed on SEDAR+ at www.sedarplus.com and on EDGAR at www.sec.gov/edgar under Fortuna Mining Corp.’s profile within 45 days of the date of this news release. The technical report will also be available on the Company’s website at www.fortunamining.com.
QualifiedPerson
Raul Espinoza, Director of Technical Services for Fortuna Mining Corp., is a Fellow and Chartered Professional of the Australasian Institute of Mining and Metallurgy (FAusIMM CP) and a Qualified Person as defined by National Instrument 43-101, Standards of Disclosure for Mineral Projects. Mr. Espinoza has reviewed and approved the scientific and technical information pertaining to the Project contained in this news release and has verified the underlying data.
AboutFortunaMiningCorp.
Fortuna Mining Corp. is a Canadian precious metals mining company with three operating mines and a portfolio of exploration projects in Argentina, Côte d’Ivoire, Guinea, Guyana, and Peru, as well as the Diamba Sud Gold Project in Senegal. Sustainability is at the core of our operations and stakeholder relationships. We produce gold and silver while creating long-term shared value through efficient production, environmental stewardship, and social responsibility. For more information, please visit our website at www.fortunamining.com
ON BEHALF OF THE BOARD
JorgeA.Ganoza
President, CEO, and Director
Fortuna Mining Corp.
Investor Relations:
Carlos Baca | info@fmcmail.com | fortunamining.com | X | LinkedIn | YouTube | Instagram | TikTok
Cautionary Note Regarding Forward-Looking Statements
This news release contains forward-looking statements which constitute “forward-looking information” within the meaning of applicable Canadian securities legislation and “forward-looking statements” within the meaning of the “safe harbor” provisions of the Private Securities Litigation Reform Act of 1995 (collectively, “Forward-looking Statements”). All statements included herein, other than statements of historical fact, are Forward-looking Statements and are subject to a variety of known and unknown risks and uncertainties which could cause actual events or results to differ materially from those reflected in the Forward-looking Statements. Forward-looking Statements contained in this news release include, without limitation, statements with respect to: the Company’s expectation of increasing annual gold production by 60% and the anticipated timing thereof; the calculation of Mineral Resources and Mineral Reserves at the Project and the possibility of eventual economic extraction of minerals from the Project; the identification of future Mineral Resources at the Project; the Company’s ability to convert more of its existing Mineral Resources into categories of Mineral Resources or Mineral Reserves of increased geological confidence; the projected yearly gold production profile from open pit operations, all-in sustaining costs, mill throughput and average grades; future plans for exploration drilling; the projected economics of the Project, including margins, taxes, average annual production and costs, potential recovery rates, the net present value (NPV) of the Project, the internal rate of return (IRR) on the Project, project payback period, cash flow, mine life, the total initial capital and sustaining capital required, and closure costs; the project design, including the mining method, tailings storage facility, process plant, water storage dam, power sources, and stockpile establishment; the plans for completing the early works program; the project development timeline to production; the filing of the technical report supporting the FS; obtaining the exploitation permit and other permitting approvals, a final investment decision, and the development, construction and production at the Project; the timing of and future prospects for exploration and any expansion of the Project.
These statements are based on information currently available to the Company, and the Company provides no assurance that actual results will meet management's expectations. In certain cases, Forward-looking Statements may be identified by such terms as "anticipates", "believes", "could", "estimates", "expects", "may", "shall", "will", or "would". Forward-looking Statements contained in this news release are based on certain factors and assumptions regarding, among other things, the FS, the estimation of Mineral Resources and Mineral Reserves and any potential upgrades thereof, gold metal prices, the timing and amount of future exploration and development expenditures, the estimation of initial and sustaining capital requirements, the estimation of labor and operating costs, the availability of necessary financing and materials to continue to explore and develop the Company’s properties in the short and long-term, the progress of exploration and development activities, the receipt of necessary regulatory approvals, the royalties, taxes payable, contributions to the social development fund etc. set out in the FS are based upon the provisions of the Mining Convention between Boya S.A. and the State of Senegal dated April 8, 2015. There can be no assurance that such provisions will not be renegotiated by the State as part of the exploitation permit approval process, and assumptions with respect to currency fluctuations, environmental risks, title disputes or claims, and other similar matters. The Company also notes that, the State of Senegal will assume a 10% free-carried ownership interest in the Project when an exploitation permit is granted and may elect to purchase up to an additional 25% contributory interest in Boya SA at a “fair price” as determined through an independent valuation. While the Company considers these assumptions to be reasonable based on information currently available to it, they may prove to be incorrect.
Although the Company believes the expectations expressed in such Forward-looking Statements are based on reasonable assumptions, such statements are not guarantees of future performance and actual results or developments may differ materially from those in the Forward-looking Statements. Factors that could cause actual results to differ materially from those in Forward-looking Statements include: changes in market conditions, unsuccessful exploration results, possibility of project cost overruns or unanticipated costs and expenses, changes in the costs and timing of the development of new deposits, inaccurate Mineral Resources and Mineral Reserves estimates, changes in the price of gold, unanticipated changes in key management personnel and general economic conditions; the duration and impacts of geo-political uncertainties on the Company’s production, workforce, business, operations and financial condition; the expected trends in mineral prices, inflation and currency exchange rates; that all required approvals and permits will be obtained for the Company’s business and operations on acceptable terms; that there will be no significant disruptions affecting the Company’s operations; whether the Senegalese Government’s royalty percentage may increase in the future; and whether the State of Senegal elects to purchase up to an additional 25% interest in Boya SA at a “fair price” as determined through an independent valuation. Mining exploration and development is an inherently risky business. Accordingly, actual events may differ materially from those projected in the Forward-looking Statements. This list is not exhaustive of the factors that may affect any of the Company's Forward-looking Statements, including the factors included in the Company’s annual information form for the year ended December 31, 2025. These and other factors should be considered carefully, and readers should not place undue reliance on the Company's Forward-looking Statements. Forward-looking Statements are made as of the date hereof, and the Company disclaims any obligation to update any Forward-looking Statements, whether as a result of new information, future events, or results or otherwise, except as required by law. There can be no assurance that these Forward-looking Statements will prove to be accurate, as actual results and future events could differ materially from those anticipated in such statements.
Cautionary Note to United States Investors Concerning Mineral Resources and Mineral Reserves
Technical disclosure regarding the Company’s properties included herein has been prepared in accordance with National Instrument 43-101, Standards of Disclosure for Mineral Projects ("NI 43-101") and the Canadian Institute of Mining, Metallurgy, and Petroleum Definition Standards on Mineral Resources and Mineral Reserves. Canadian standards, including NI 43-101, differ from the requirements of the Securities and Exchange Commission, and information included herein may not be comparable to similar information disclosed by U.S. companies.
Cautionary Note on Non-IFRS Measures
This news release includes certain terms or performance measures commonly used in the mining industry that are not defined under International Financial Reporting Standards (“IFRS”), including EBITDA, cash costs, and AISC. Non-IFRS measures do not have any standardized meaning prescribed under IFRS and, therefore, they may not be comparable to similar measures employed by other companies. We believe that, in addition to conventional measures prepared in accordance with IFRS, certain investors use this information to evaluate our performance. The data presented is intended to provide additional information and should not be considered in isolation or as a substitute for measures of performance prepared in accordance with IFRS. Readers should also refer to our management’s discussion and analysis for the three months ended March 31, 2026, which is available under our corporate profile on SEDAR+ at www.sedarplus.ca and on EDGAR at www.sec.gov/edgar for a more detailed discussion of how we calculate such measures.
All-in Sustaining Costs
The Company, in conjunction with an initiative undertaken within the gold mining industry, has adopted AISC and all-in sustaining cost measures based on guidance published by World Gold Council ("WGC"). The Company conforms its AISC and all-in cash cost definitions to that set out in the guidance and the Company has presented the cash cost figures on a sold ounce basis. We define All-in Sustaining Costs as total production cash costs incurred at the applicable mining operation but excludes mining royalty recognized as income tax within the scope of IAS12, as well as non-sustaining capital expenditures. Sustaining capital expenditures, corporate selling, general and administrative expenses, gains from blue-chip swaps and brownfield exploration expenditures are added to the cash cost. AISC is estimated at realized metal prices.
Cash Costs
Cash costs include all direct and indirect operating cash costs related directly to the physical activities of producing metals, including mining and processing costs, third-party refining and treatment charges, on-site general and administrative expenses, applicable production taxes and royalties which are not based on sales or taxable income calculations , net of by-product credits, but are exclusive of the impact of noncash items that are included as part of the cost of sales that is calculated in the consolidated Income Statement including depreciation and depletion, reclamation, capital, development and exploration costs.
Management believes that cash cost and AISC measures provide useful information regarding the Company's ability to generate operating earnings and cash flows from its mining operations and uses such measures to monitor the performance of the Company's mining operations. In addition, the Company believes that each measure provides useful information to investors in comparing, on a mine-by-mine basis, our operations relative performance on a period-by-period basis, against our competitors’ operations.
EBITDA
EBITDA is a non-IFRS measure which is calculated as net income before interest, taxes, depreciation, and amortization, and is an alternate measure of profitability to net income. Management believes it is used by investors and analysts as useful indicators of assessing a company's profitability and financial performance.
A PDF accompanying this announcement is available at: http://ml.globenewswire.com/Resource/Download/da853e58-e48d-48f1-9840-be47ec017c6b
Photos accompanying this announcement are available at https://www.globenewswire.com/NewsRoom/AttachmentNg/ac1bcf0e-7a2b-4488-ad4c-dd32dc717677
https://www.globenewswire.com/NewsRoom/AttachmentNg/ba8e909c-f5e9-44a5-998b-48a71971e117
https://www.globenewswire.com/NewsRoom/AttachmentNg/6cabc6bb-e297-4d3b-bac3-85ba54cc32a1
https://www.globenewswire.com/NewsRoom/AttachmentNg/172dd4ca-e3b9-401f-b18d-f44eaba1b0a2
https://www.globenewswire.com/NewsRoom/AttachmentNg/9da7b819-bbcc-408b-bcf7-fb23fe8c03ef
https://www.globenewswire.com/NewsRoom/AttachmentNg/ec0e9c96-65f2-4582-8961-d091e8fb796c


Figure 1
Diamba Sud FS LOM Production and Cost Profile
Figure 2
Diamba Sud Mine General Site Infrastructure General Arrangement
Figure 3
Diamba Sud FS LOM processing schedule
Figure 6
After-Tax NPV5% Sensitivities
Figure 7
Diamba Sud After-Tax IRR Sensitivities, Base Case of 60%
Figure 8
Diamba Sud Projected Development Timeline and Key Milestones
© 2026 Canjex Publishing Ltd. All rights reserved.