(via TheNewswire)
Mont-St-Hilaire, Quebec, Canada / TheNewswire / October 30 , 2018 - Mr. Renaud Hinse, President and Chief Executive Officer of Abcourt Mines Inc. (TSX-V: ABI, Berlin: AML-BE and Frankfurt Stock Exchanges: AML-FF) (" Abcourt " or the " Company ") is pleased to announce that a NI 43-101 update report of resources on the Elder mine and the Tagami property has been prepared by Mr. Jean-Pierre Berube, engineer in geology. Mr. Berube is an independent consultant. Mr. Renaud Hinse, mining engineer, has prepared an update of the Preliminary Economic Assessment (PEA) report prepared by Roche, Consulting-group in 2012. An independent PEA was not required as there has not been a 100% increase in the mineral resource estimate. Both persons are designated as "qualified persons" according to NI 43-101, each one of them has pertinent experience in his domain.
The Elder mine is made up of one mining concession, two mining leases and claims.
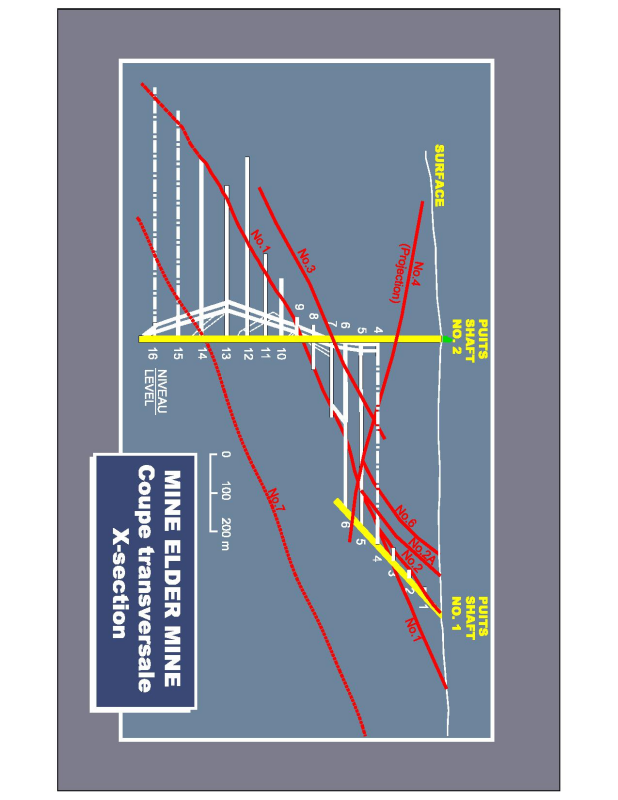
At the Elder mine, vein No. 1 vein is the main vein. It extends over a strike distance of about 650 meters, from surface to the bottom of the mine. The dip is 22 o to the South. It is accompanied by vein #3 and #6 with the same strike and dip. There are also veins No.2 and No.2A, from the 4 th level to surface, with the same strike and a dip of 40 o S and vein No.4 with a North-South direction and a dip of 22 o to the East. See the cross-section on the following page.
Vein #7 is indicated in one hole with marginal values. Additional drilling will be done to assess the economic potential of this structure.
The Tagami property is made up of 10 claims and it is located immediately to the north of the Elder property. The known mineralization from surface to a depth of 150 meters is found in a shear zone with a strike of N-40 o -E and a dip of 50% to the south-east and in the walls of the shear zone where veins with the same direction are found with a dip of 20 o to the south-east.
Abcourt owns 100% of the Elder and Tagami properties.
See a cross-section of the Elder mine on the following page.
Click Image To View Full Size
Table of resources and parameters used
As of May 31, 2018, mineral resources in the measured and indicated categories were as follows:
ZONE | MEASURED | INDICATED | MEASURED+INDICATED | GOLD OUNCES (OZ) |
TONNES | GRADE | TONNES | GRADE | TONNES | GRADE |
(metric) | (g/t) | (metric) | (g/t) | (metric) | (g/t) |
ELDER | | | | | | | |
VEIN1 | 32,607 | 5.09 | 159,502 | 6.91 | 192,109 | 6.60 | 40,755 |
VEIN2 | 5,343 | 5.36 | 75,957 | 6.39 | 81,300
| 6.32 | 16,516 |
VEIN3 | 0 | 0,00 | 15,321 | 6.27 | 15,321 | 6.27 | 3,088 |
VEIN4 | 18,181 | 6.35 | 104,176 | 6.26 | 122,357 | 6.28 | 24,691 |
VEIN6 | 0 | 0 | 52,739 | 6.53 | 52,739 | 6.53 | 11,077 |
SUB-TOTAL | 56,131 | 5.52 | 409,695 | 6.57 | 463,826 | 6.45 | 96,126 |
TAGAMI | 0 | 0,00 | 174,258 | 6.22 | 174,258 | 6.22 | 34,848 |
TOTAL: | 56,131 | 5.52 | 581,952 | 6.47 | 638,083 | 6.38 | 130,974 |
Elder and Tagami Measured and Indicated Resources
The technical parameters used for the calculation of measured and indicated resources were:
Density: 2.70 t/m 3 , minimum thickness: 1.8 m
Lower cutting grade = 3.45 g/t Au
Higher cutting grade = 31.1 g/t Au
The total measured and indicated resources for Elder and Tagami is 638 083 tonnes with a grade of 6,38 g/t Au.
In addition, the inferred resources total 547 746 tonnes with a grade of 5,48 g/t Au. See below:
CATEGORIES | INFERRED | GOLD OUNCES (Oz) |
ZONE | TONNES | GRADE |
(metric) | (g/t) |
ELDER | | | |
VEIN1 | 119,276 | 5.41 | 20,749 |
VEIN2 | 75,051 ,7 | 5.70 | 13,755 |
VEIN3 | 43,847 | 5.37 | 7,571 |
VEIN4 | 102,169 | 7.89 | 25,920 |
VEIN6 | 39,808 | 5.36 | 6,877 |
SUB-TOTAL | 380,251 | 6.12 | 74,872 |
TAGAMI | 167,495 | 5.48 | 29,510 |
TOTAL: | 547,746 | 5.93 | 104,382 |
Inferred resources
The technical parameters used for the calculation of the inferred resources were the same as those used for the calculation of the measured and indicated resources.
Note: Presently, the inferred resources are not considered as measured and indicated resources. However, it is reasonably expected that the majority of the inferred mineral resources could be upgraded to measured or indicated mineral resources with continued exploration.
RESOURCES WITH A REASONNABLE PROSPECT FOR EVENTUAL
ECONOMIC EXTRACTION
| MINERAL RESOURCES MEASURED AND INDICATED | RECOVERABLE MINERAL RESOURCES 85% | 40% DILUTION | RESOURCES AS DESCRIBED ABOVE |
| TONNES | GRADE g/t | TONNES | GRADE g/t | TONNES | GRADE g/t | TONNES | GRADE g/t |
MEASURED | 56,131 | 5.52 | 47,711 | 5.52 | 19,084 | 0.0 | 66,795 | 3.94 |
INDICATED | 407,695 | 6.57 | 346,541 | 6.57 | 138,616 | 0.0 | 485,157 | 4.69 |
TOTAL | 463,826 | 6.45 | 394,252 | 6.32 | 157,700 | 0.0 | 551,952 | 4.51 |
Here is the CIM definition of resources :
" A Mineral Resource is a concentration or occurrence of solid material of economic interest in or on the Earth's crust in such form, grade or quality and quantity that there are reasonable prospects for eventual economic extraction. The location, quantity, grade or quality, continuity and other geological characteristics of a Mineral Resource are known, estimated or interpreted from specific geological evidence and knowledge, including sampling."
Dilution factor during the mining
Commercial production started on January 1, 2016.
From January 1, 2016 to June 30, 2018, a total of 267,064 metric tonnes were mined with a grade of 4.43 g/t of gold (car samples).
In his preliminary economic study in 2012, Roche used a factor of 85% for the recovery of resources. We used the same factor.
In the mining operation, to be sure to extract all the mineralization, it is necessary to take some waste. If we take only 0.15 m above and below the ore in an 1.8 m face, we get 15% dilution. In addition, frequent changes of dip of the mineralization result in getting some uncontrolled dilution. We also have to adjust to variations of grade in veins. Blasts in sheared zones also produce unwanted overbreaks. All these factors combined account for an apparent 40% dilution. We give no grade to the dilution material.
However, Roche used only 20% of dilution with a grade of 0.69 g/t Au. The Roche estimate was made without the benefit of test mining, as the mine was flooded at that time. According to our experience, by doing our best to control the mining, we get 40% of dilution, without any value given to the dilution material, as explained previously.
Mining method
Veins generally have a dip angle of 22 o and a 2-meter thickness.
The mine is serviced by 2 shafts and 16 levels. Shaft #1 is used for the ventilation of the mine and as an escape way. Shaft #2 is used for production. The distance between levels varies between 41 and 61 meters. Drifts (2.7 m x 2.8 m) give access to the mineralized zone. Then, drifts follow the zone to give access to stopping sites. On levels 3, 4 and 6, drifts will follow the mineralization over a distance of 240 meters.
Mining is done with the room and pillar method. The roof and part of the walls are secured with rock bolts and screen. With this method of mining, about 15% of the resources are left in pillars. Part of these pillars will be recovered at the end of the mine.
The width of rooms and the size of pillars were determined by a geotechnical study done by Golder Associates in 1986 and by an inspection in 2014.
A stope team is made up of two drillers, 2 scrapping operators and one mucker.
The monthly rate of production of Elder is about 11,000 tonnes. Our objective is to get 12,500 tonnes per month. The life of the mine, based on the existing measured and indicated resources, is 4.25 years. The eventual conversion of inferred resources into measured and indicated resources would add about 3.5 years for a total of 7.75 years, without taking into account the Tagami resources.
Economical analysis
General
A preliminary economical analysis was prepared according to the net present value method. This method is built on the basis of a constant dollar. There is no provision for inflation nor for taxes to pay. The mine is presently in exploitation, without debt. The internal rate of return was not used in this report as the mine is operating and there is no initial investment.
Hypothesis
The hypothesis used are indicated in the table below. The sensitivity analysis is made for variations in the price of gold of plus and minus 10%.
Hypothesis
Description | Units | Value |
Price | $US / ounce | 1,230 |
Exchange Rate | Cdn / US | 1.30 |
Discount Rate | Annual % | 8 |
Royalties
The cost of royalties is already incorporated into operating costs.
Technical Hypothesis
Technical Hypothesis
Description | Units | Value $ |
Recoverable measured and indicated resources | Tonnes | 551,953 |
Annual rate of extraction | Tonnes / year | 130,000 |
Life of mine | Years | 4.25 |
Grade of mineralization | g/t Au | 4.51 |
Gold recovery in mill | % | 97 |
Net recoverable value | $ Cdn/t | 224.74 |
Annual gold production | Ounces | 18,300 |
Ongoing capital costs | $ Cdn/t | 19.19 |
Total operating costs per tonne | $ Cdn/t | 191.24 |
Gold refining | $ Cdn/oz | 1.31 |
Financial model and results
A summary of the technical hypothesis is given in the table above. A total revenue at the mine of $124 M is expected, that is $224,74 per tonne. Ongoing capital expenditures, necessary in the course of mining, is estimated at $10,6 M, that is $19,19 per tonne of recoverable measured and indicated resources.
Operating costs are $191,24 per tonne for a total of $105,4 M, including $6,89 per tonne of royalties for a total of $3,8 M. A working capital of about $2,5 M is necessary to cover about one month of operation costs, but this amount was already available on June 30, 2018. The financial analysis shows a net cash flow of $7,9 M before taxes and $4,1 M after taxes. The net present value, discounted at 8%, is $6,5 M before taxes and $3,5 M after taxes.
Summary of project evaluation
Description | Evaluation base $ Cdn |
Total mine revenue | 124,000,000 |
Ongoing capital expenditures | 10,600,000 |
Total operating expenses including royalties | 105,600,000 |
Net cash flow before taxes | 7,900,000 |
Net cash flow after taxes | 4,200,000 |
Taxes and income taxes
The Elder mine is subject to provincial and federal income taxes and Quebec mining taxes. The income tax is calculated according to the federal and provincial tax legislations. The federal income tax is 15%. The provincial income tax varies as follows:
- 2017 11.8 %
- 2018 11.7 %
- 2019 11.6 %
- 2020 11.5 %
The Quebec mining tax is calculated according to the Quebec Mining tax Law modified in 2014. According to the new Law, a producer has to pay a minimum progressive rate determined by the value of production at the shaft collar and a progressive mining tax on annual profits. The new mining tax on annual profits is calculated with a progressive rate of 16% to 28%, (replacing the single rate of 16% with the previous Law), determined according to the profit margin of the operator:
- Up to 35% profit margin 16%
- From 35% to 50% profit margin 22%
- From 50% to 100% profit margin 28%
It is obvious that according to the new Law, an enterprise with a high rate of profit will pay a higher mining tax.
The minimum progressive mining tax corresponds to 1% of the first $80 M of the value of production at the shaft collar and 4% of the value of production at the shaft collar exceeding $80 M.
Sensitivity analysis
A sensitivity analysis was done, based on the economical and technical hypothesis presented in preceding sections to estimate the impact of variations in capital expenditures, operating costs and the price of gold on the net present value, discounted at 8%. Each variable is analysed separately. The analysis was made for variations of 10% for each item.
According to the analysis made, the net present value is not affected greatly by an increase or a decrease in the capital cost. In fact, the capex line is almost horizontal. This indicates that variations of this item have little effect on the net present value. The proportion of the capital cost (less than 1%), compared to all the other costs, is not important and that explains the fact that a variation in costs has a low impact on the present value. The latter is more sensitive to operating costs and the price of gold.
The net present value is equally sensitive to the grade of the ore. An increase of 10% of grade, that is to 5 g/t of gold would increase the net cash flow, before taxes by $15 M, and would give a present value of about $11.9 M. During the latest quarter of the 2018 fiscal period, from April to June, the average grade of the mineralization was 4,81 g/t of gold. Our objective, for the next months, is to have 5,0 g/t of gold at the mill.
This graph and the previous one show important variations in the grade of mineralization, the price of gold and operating costs. Actual variations might be less accentuated.
Quality control and assurance
In its operations, Abcourt applies a procedure for the three methods of sampling used: drill core (series D), chips (series F) and broken muck (series M), to reconcile grade with the ounces produced at the Sleeping Giant mill. The lab is directed by a chief analyst with adequate experience in this domain. This lab maintains an internal quality control program. Assay results of blanks, duplicates and standards appear regularly (3/24) on assay reports.
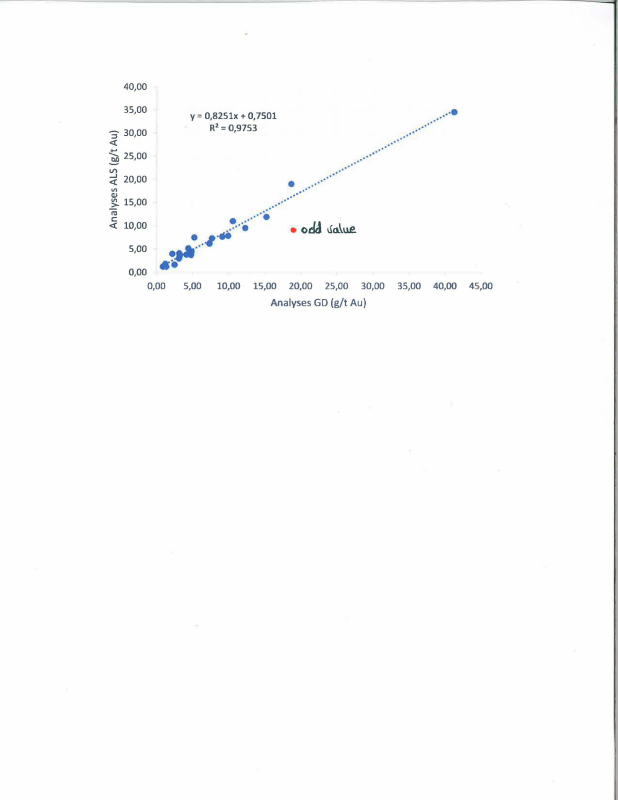
Check assays done for 15 chip samples (F) and 10 muck samples (M) done by an accredited laboratory (ALS-Chemex) indicate that the assay results from both laboratories have a very good coefficient of correlation (R 2 =0.975) even after including an odd value for sample M18465. See graph below.
Click Image To View Full Size
Strong correlation coefficient between Sleeping Giant (GD)
and ALS-Chemex (ALS) assays without the odd value
About Abcourt Mines Inc.
Abcourt Mines Inc. is a gold producer and a Canadian exploration company with strategically located properties in northwestern Quebec, Canada. The Elder property has gold resources and a positive P.E.A. study (2012). Abcourt is focusing on the exploitation of the Elder mine.
The Abcourt-Barvue property has silver-zinc resources (2014). A feasibility study was completed in 2007 by Roche / Genivar. An update is being prepared now.
In 2016, Abcourt acquired the Sleeping Giant mine and mill, located half-way between Amos and Matagami, in Abitibi, Quebec, in the territory covered by the Plan Nord of the Quebec government. The mill has a capacity of 700 to 750 tonnes per day. A NI 43-101 resource estimate was recently filed.
To know more about Abcourt Mines Inc. (TSXV: ABI), please visit our web site at www.abcourt.com and consult our filings under Abcourt's profile on www.sedar.com.
This press release was prepared by Mr. Renaud Hinse, Engineer and President of Abcourt Mines Inc. Mr. Hinse is a "Qualified Persons" under the terms of Regulation 43-101. Mr. Hinse has approved the scientific and technical disclosure.
Forward-Looking Statements
This news release contains forward-looking statements that include risks and uncertainties. When used in this news release, the words "estimate", "project", "anticipate", "expect", "intend", "believe", "hope", "may" and similar expressions, as well as "will", "shall" and other indications of future tense, are intended to identify forward-looking statements. The forward-looking statements are based on current expectations and apply only as of the date on which they are made. Except as may be required by law, the Corporation undertakes no obligation and disclaims any responsibility to publicly update or revise any forward-looking statements or information, whether as a result of new information, future events or otherwise.
The factors that could cause actual results to differ materially from those indicated in such forward-looking statements include changes in the prevailing price of gold, the Canadian-United States exchange rate, grade of ore mined and unforeseen difficulties in mining operations that could affect revenue and production costs. Other factors such as uncertainties regarding government regulations could also affect the results. Other risks may be set out in Abcourt' annual and periodic reports. The forward-looking information contained herein is made as of the date of this news release.
For more information, please contact:
Renaud Hinse, President and CEO
T : 819 768-2857 450 446-5511
F : 819 768-5475 450 446-3550
Email: rhinse@abcourt.com
Neither TSX Venture Exchange nor its Regulation Services Provider (as that term is defined in the policies of the TSX Venture Exchange) accepts responsibility for the adequacy or accuracy of this release.
Copyright (c) 2018 TheNewswire - All rights reserved.
© 2024 Canjex Publishing Ltd. All rights reserved.