
Company Website:
http://www.hgv.com
ORLANDO, Fla. -- (Business Wire)
Hilton
Grand Vacations Inc. (NYSE:HGV)(“HGV” or “theCompany”)
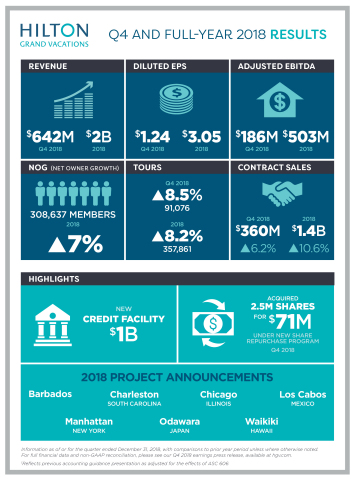
today reports its full-year and fourth-quarter 2018 results. Highlights
include:
This press release features multimedia. View the full release here:
https://www.businesswire.com/news/home/20190227005960/en/
Hilton Grand Vacations Inc. (NYSE:HGV) reports its full-year and fourth-quarter 2018 results. (Graphic: Business Wire)
KEY HIGHLIGHTS
Full-Year 2018 Results
-
Total revenues were $2.0 billion, net income was $298 million and
diluted EPS was $3.05.
-
Adjusted EBITDA was $503 million, which was at the high end of
guidance. Adjusted EBITDA includes a $79 million net benefit from
recognitions related to sales that occurred prior to 2018.
-
Contract sales increased 10.6 percent and Net Owner Growth (NOG) was
7.0 percent.
-
Adjusted free cash flow was ($44) million.
-
Increased credit facility to $1 billion and announced $200 million
share repurchase authorization.
-
Repurchased 2.5 million shares for $71 million under the new
authorization at an average price of $28.62.
Outlook
-
Increasing diluted EPS guidance to $2.74 to $2.89 from $2.68 to $2.84
to reflect fourth quarter 2018 share repurchases.
-
Net income is projected to be between $260 million and $275 million.
-
Adjusted EBITDA is projected to be between $450 million and $470
million.
-
Contract sales are projected to increase 9.0 to 11.0 percent.
-
Adjusted free cash flow is projected to be between $60 million and
$120 million.
-
2019 outlook assumes no construction-related deferrals, recognitions
or additional share repurchases.
Overview – Full-Year 2018
“2018 was a remarkable year as we saw 7 percent NOG growth and
double-digit contract sales and Adjusted EBITDA growth,” says Mark Wang,
president and CEO, Hilton Grand Vacations. “More importantly, we
successfully put in place a pipeline of high-return projects in
high-demand markets to accelerate our growth in 2019 and beyond. With
our recent project announcement, Maui joins Japan, Charleston, Cabo,
Chicago and Barbados on the roster of exciting new destinations we’ve
announced over the past 15 months. We believe our strong 2018 results
and the long-term outlook we shared at our recent Investor Day
demonstrate HGV’s ability to continue our momentum and drive long-term
value for our shareholders.”
For the year ended Dec. 31, 2018, total revenues were $2.0 billion
compared to $1.7 billion for the year ended Dec. 31, 2017. Diluted EPS
was $3.05 for the year ended Dec. 31, 2018, compared to $3.28 for the
year ended Dec. 31, 2017. Net income and Adjusted EBITDA was $298
million and $503 million, respectively, for the year ended Dec. 31,
2018, compared to $327 million and $395 million, respectively, for the
year ended Dec. 31, 2017.
Net income and Adjusted EBITDA for the year ended Dec. 31, 2018,
included a $79 million net benefit from recognitions related to sales at
The Residences property that occurred prior to 2018 that were deferred
until the second quarter of 2018 when construction of that project was
completed.
Net income for the year ended Dec. 31, 2017, included a deferred income
tax benefit of $129 million, which was mostly attributable to a benefit
of $132 million for the quarter ended Dec. 31, 2017, related to the
one-time re-measurement of net deferred income taxes under the new U.S.
federal income tax rate provided by the Tax Cuts and Jobs Act of 2017.
Segment Highlights – Full Year 2018
Real Estate Sales and Financing
For the year ended Dec. 31, 2018, Real Estate Sales and Financing
segment revenues were $1.5 billion, an increase of 18.0 percent compared
to the year ended Dec. 31, 2017. Real Estate Sales and Financing segment
Adjusted EBITDA and Adjusted EBITDA margin was $447 million and 30.6
percent, respectively, for the year ended Dec. 31, 2018, compared to
$359 million and 29.0 percent, respectively, for the year ended Dec. 31,
2017.
Results for the year ended Dec. 31, 2018, included a $79 million net
benefit from recognitions related to sales at The Residences property
that occurred prior to 2018 that were deferred until the second quarter
of 2018 when construction of that project was completed.
For the year ended Dec. 31, 2018, contract sales increased 10.6 percent
to $1.4 billion compared to the year ended Dec. 31, 2017.
Fee-for-service contract sales represented 55.0 percent of contract
sales for the year ended Dec. 31, 2018, compared to 54.4 percent for the
prior year. For the year ended Dec. 31, 2018, tours increased 8.2
percent to 357,861 and VPG increased 2.4 percent to $3,743 compared to
the prior year.
Financing revenues were $158 million for the year ended Dec. 31, 2018,
an increase of 7.5 percent compared to the prior year.
The weighted average FICO score of new loans made to U.S. and Canadian
borrowers at the time of origination increased to 749 for the year ended
Dec. 31, 2018, from 743 for the year ended Dec. 31, 2017.
For the year ended Dec. 31, 2018, 65.8 percent of HGV’s sales were to
customers who financed part of their purchase.
As of Dec. 31, 2018, gross timeshare financing receivables were $1.3
billion with a weighted average interest rate of 12.3 percent and a
weighted average remaining term of 7.8 years. As of Dec. 31, 2018, 93.2
percent of HGV’s financing receivables were current, compared to 94.6
percent as of Dec. 31, 2017.
Resort Operations and Club Management
For the year ended Dec. 31, 2018, Resort Operations and Club Management
segment revenues were $422 million, an increase of 15.0 percent compared
to the year ended Dec. 31, 2017. Resort Operations and Club Management
segment Adjusted EBITDA and Adjusted EBITDA margin was $245 million and
58.1 percent, respectively, for the year ended Dec. 31, 2018, compared
to $204 million and 55.6 percent, respectively, for the year ended Dec.
31, 2017.
Overview – Fourth Quarter 2018
For the quarter ended Dec. 31, 2018, diluted EPS was $1.24 compared to
$1.83 for the quarter ended Dec. 31, 2017. Net income and Adjusted
EBITDA was $120 million and $186 million, respectively, for the quarter
ended Dec. 31, 2018, compared to $183 million and $101 million,
respectively, for the quarter ended Dec. 31, 2017. Total revenues for
the quarter ended Dec. 31, 2018, were $642 million compared to $447
million for the quarter ended Dec. 31, 2017.
Net income and Adjusted EBITDA for the quarter ended Dec. 31, 2018,
included an $81 million net benefit from recognitions related to sales
at the Ocean Tower property that occurred during the first nine months
of 2018 that were deferred until the fourth quarter of 2018 when
construction of that phase of the project was completed.
As noted, results for the quarter ended Dec. 31, 2017, included a
deferred income tax benefit of $132 million.
Segment Highlights – Fourth Quarter 2018
Real Estate Sales and Financing
For the quarter ended Dec. 31, 2018, Real Estate Sales and Financing
segment revenues were $495 million, an increase of 53.3 percent compared
to the quarter ended Dec. 31, 2017. Real Estate Sales and Financing
segment Adjusted EBITDA and Adjusted EBITDA margin was $173 million and
34.9 percent, respectively, for the quarter ended Dec. 31, 2018,
compared to $96 million and 29.7 percent, respectively, for the quarter
ended Dec. 31, 2017.
Results for the quarter ended Dec. 31, 2018, included an $81 million net
benefit from recognitions related to sales at the Ocean Tower property
that occurred during the first nine months of 2018 that were deferred
until the fourth quarter of 2018 when construction of that phase of the
project was completed.
Contract sales for the quarter ended Dec. 31, 2018, increased
6.2 percent to $360 million compared to the quarter ended Dec. 31, 2017.
Fee-for-service contract sales represented 56.1 percent of contract
sales for the quarter ended Dec. 31, 2018, compared to 54.9 percent for
the quarter ended Dec. 31, 2017. For the quarter ended Dec. 31, 2018,
compared to the quarter ended Dec. 31, 2017, tours increased 8.5 percent
to 91,076 and VPG decreased 2.0 percent to $3,775.
Financing revenues were $41 million for the quarter ended Dec. 31, 2018,
an increase of 7.9 percent compared to the quarter ended Dec. 31, 2017.
Resort Operations and Club Management
For the quarter ended Dec. 31, 2018, Resort Operations and Club
Management segment revenue was $118 million, an increase of 21.6 percent
compared to the quarter ended Dec. 31, 2017. Resort Operations and Club
Management segment Adjusted EBITDA and Adjusted EBITDA margin was
$66 million and 55.9 percent, respectively, for the quarter ended Dec.
31, 2018, compared to $51 million and 52.6 percent, respectively, for
the quarter ended Dec. 31, 2017.
Inventory
The estimated contract sales value of HGV’s total pipeline is
approximately $9.9 billion at current pricing, which represents
approximately 7.0 years of sales at the current trailing 12-month sales
pace.
The total pipeline includes approximately 1.4 years of sales relating to
inventory that is currently available for sale at open or soon-to-open
projects. The remaining 5.6 years of sales is inventory at new or
existing projects that will become available for sale in the future upon
registration, delivery or construction.
Owned inventory represents 76 percent of HGV’s total pipeline.
Approximately 13 percent of the owned inventory pipeline is currently
available for sale.
Fee-for-service inventory represents 24 percent of HGV’s total pipeline.
Approximately 40 percent of the fee-for-service inventory pipeline is
currently available for sale.
With 32 percent of the pipeline consisting of just-in-time inventory and
24 percent consisting of fee-for-service inventory, capital-efficient
inventory represents 56 percent of HGV’s total pipeline.
Balance Sheet and Liquidity
Total cash and cash equivalents was $180 million as of Dec. 31, 2018,
including $72 million of restricted cash.
As of Dec. 31, 2018, HGV had $604 million of corporate debt, net
outstanding with a weighted average interest rate of 5.2 percent and
$759 million of non-recourse debt, net outstanding with a weighted
average interest rate of 3.1 percent.
Free cash flow was ($222) million for the year ended Dec. 31, 2018,
compared to $309 million in the prior period. Adjusted free cash flow
was ($44) million for the year ended Dec. 31, 2018, compared to $200
million in the prior period.
In November, the Company increased its credit facility to $1 billion
from $400 million, including the expansion of its revolver to $800
million from $200 million and refinanced and increased its existing term
loan to $200 million. The new facility includes incrementally better
pricing than the previous facility and provides HGV greater flexibility
to pursue its capital deployment strategies. As of Dec. 31, 2018, there
was $684 million of available capacity on the revolver.
Share Repurchase Program
On Nov. 28, 2018, the Company announced that its board of directors
approved a $200 million share repurchase program. Under the program,
repurchases may be carried out through open-market purchases, block
trades or other transactions subject to customary restrictions.
Under the new authorization, during the fourth quarter, the Company
repurchased 2.5 million shares for $71 million at an average price of
$28.62. This was the maximum amount permitted given daily trading volume
restrictions and the number of non-blackout trading days available
during the quarter.
Subsequent Event
Subsequent to the fourth quarter, HGV announced that it will develop its
first property on the Hawaiian island of Maui. Maui Bay Villas by Hilton
Grand Vacations will be HGV’s 10th property in Hawaii. The
multi-phase, 388-unit project is located on a 27-acre site on the
island’s southwestern coast with 740 feet of oceanfront. The resort will
offer a selection of one-, two- and three-bedroom suites across a
resort-style campus comprised of a dozen one- to four-story buildings.
The initial project phase, which is scheduled for completion in early
2021, includes 131 units within four buildings and all supporting
buildings and improvements. Planned amenities include a clubhouse with
restaurant, keiki club, fitness center, grab-and-go market, “super pool”
with pool bar, oceanfront beach club and over 15 acres of open-lawn
recreational space. Sales are anticipated to begin in early 2020. The
development costs for this project were included in the 2019-2021
inventory spending guidance the Company provided at its Investor Day on
Dec. 4, 2018.
Total Construction Deferrals and/or Recognitions Included in Results
Reported Under Accounting Standards Codification Topic 606 (“ASC 606”)
The Company’s Adjusted EBITDA as reported under ASC 606 includes
construction-related recognitions and deferrals of revenues and related
expenses as detailed in Table T-1. Under ASC 606, the Company defers
revenues and related expenses pertaining to sales at projects that occur
during periods when that project is under construction until the period
when construction is completed.
HGV deferred revenues and expense related to sales made at Ocean Tower
for the first three quarters of 2018 and recognized them in the fourth
quarter of 2018 when construction was completed on this project.
Likewise, HGV deferred revenues and expense related to sales made at The
Residences in the first quarter of 2018 and recognized them in the
second quarter of 2018 when construction was completed on this project.
These deferrals and recognitions of sales made in 2018 offset and there
was no net financial impact in 2018.
The $79 million net recognition impact for 2018 relates to the
recognition of revenues and expenses related to sales made at The
Residences prior to 2018 that were
recognized in the second quarter of 2018 when construction was
completed. A portion of these pre-2018 sales had been partially
recognized in prior periods under the previous accounting guidance, but
as part of the adoption of ASC 606 on Jan. 1, 2018, those recognitions
were reversed with a cumulative adjustment to retained earnings.
|
|
| T-1 |
| Total Construction Recognitions (Deferrals) |
|
|
|
| 2018 |
| | First
Quarter | |
| Second
Quarter | |
| Third
Quarter | |
| Fourth
Quarter |
| Full
Year |
| Net income | |
$
|
30
| | |
$
|
107
| | |
$
|
41
| | |
$
|
120
| |
$
|
298
|
|
Interest expense
| | |
7
| | | |
8
| | | |
7
| | | |
8
| | |
30
|
|
Income tax expense
| | |
10
| | | |
39
| | | |
15
| | | |
41
| | |
105
|
|
Depreciation and amortization
| | |
8
| | | |
8
| | | |
9
| | | |
11
| | |
36
|
Interest expense and depreciation and amortization included in
equity in earnings from unconsolidated affiliates
| |
|
1
| | |
|
1
| | |
|
1
| | |
|
1
| |
|
4
|
| EBITDA | | |
56
| | | |
163
| | | |
73
| | | |
181
| | |
473
|
|
Other (gain) loss, net
| | |
1
| | | |
(1
|
)
| | |
1
| | | |
—
| | |
1
|
|
Share-based compensation expense
| | |
3
| | | |
5
| | | |
5
| | | |
3
| | |
16
|
|
Other adjustment items
| |
|
2
| | |
|
8
| | |
|
1
| | |
|
2
| |
|
13
|
| Adjusted EBITDA | |
$
|
62
| | |
$
|
175
| | |
$
|
80
| | |
$
|
186
| |
$
|
503
|
| | | | | | | | | | | | |
|
NET CONSTRUCTION DEFERRAL ACTIVITY | | | | | | | | | | | | | |
|
Sales of VOI, net
| |
$
|
(66
|
)
| |
$
|
91
| | |
$
|
(45
|
)
| |
$
|
153
| |
$
|
133
|
|
Cost of VOI sales
| | |
(21
|
)
| | |
20
| | | |
(13
|
)
| | |
50
| | |
36
|
|
Sales, marketing, general and administrative expense
| |
|
(8
|
)
| |
|
11
| | |
|
(7
|
)
| |
|
22
| |
|
18
|
|
Net construction recognitions (deferrals)
| |
$
|
(37
|
)
| |
$
|
60
| | |
$
|
(25
|
)
| |
$
|
81
| |
$
|
79
|
| | | | | | | | | | | | |
|
Comparison of Reported Results Under ASC 606 Compared to Previous
Accounting Guidance
The following discussion relates to the reconciliation of HGV’s
financial results as reported under the current accounting guidance ASC
606 and the “previous accounting guidance,” ASC 605 as presented in
tables T-16 through T-21. Throughout 2018, to assist in the transition
from ASC 605 to ASC 606, HGV has been reconciling its reported 2018
results to ASC 605. Beginning in 2019, HGV will no longer present this
reconciliation.
Under ASC 606, recognitions of previously deferred revenues and expenses
increased reported revenue, net income and Adjusted EBITDA for the year
and quarter ended Dec. 31, 2018, compared to ASC 605. Under 605, total
revenues, net income and Adjusted EBITDA were $1.9 billion, $247 million
and $435 million, respectively, for the year ended Dec. 31, 2018, and
$513 million, $66 million and $114 million, respectively, for the
quarter ended Dec. 31, 2018.
Table T-2 shows that construction-related recognitions increased HGV’s
2018 reported financial results under ASC 606 by $67 million compared to
ASC 605. This reflects the recognition of revenues and expenses related
to sales made and deferred at The Residences prior
to 2018 that deferred through a cumulative adjustment to retained
earnings on Jan. 1, 2018, and subsequently recognized in the second
quarter of 2018 when construction was completed on this project. Table
T-2 also reflects offsetting deferrals and recognitions related to sales
made during 2018 at The Residences and
Ocean Tower that have no full-year financial impact.
The $12 million variance between the $79 million full-year recognitions
shown in Table T-1 and the $67 million full-year recognitions shown in
Table T-2 relates to timing differences in how recognitions are treated
between ASC 606 and ASC 605. The $67 million represents deferrals that would
have been recognized prior to 2018 under
ASC 605 based on the percentage of completion approach. As such, they
are removed from the 2018 results as part of the reconciliation to ASC
605. The remaining $12 million of deferrals is not removed from the
reconciliation because it would have been recognized in 2018 under both
ASC 606 and ASC 605 based on percentage of completion.
|
|
| T-2 |
| Construction-Related Recognitions (Deferrals) Included in Bridge
by Quarter |
| Between “As Reported” Results under ASC 606 and Previous
Accounting Guidance |
|
|
|
| 2018 |
| | First
Quarter | |
| Second
Quarter |
| Third
Quarter | |
| Fourth
Quarter |
| Full
Year |
|
Sales of VOIs, net (1) | |
$
|
(59
|
)
| |
$
|
87
| |
$
|
(58
|
)
| |
$
|
142
| |
$
|
112
|
|
Cost of VOI sales(1) | | |
(18
|
)
| | |
20
| | |
(18
|
)
| | |
46
| | |
30
|
|
Sales, marketing, general and administrative expense(1) | |
|
(8
|
)
| |
|
11
| |
|
(8
|
)
| |
|
20
| |
|
15
|
|
Net construction recognitions (deferrals)
| |
$
|
(33
|
)
| |
$
|
56
| |
$
|
(32
|
)
| |
$
|
76
| |
$
|
67
|
| | | | | | | | | | | |
|
|
Number of projects in sales and under construction
| | |
2
| | | |
1
| | |
1
| | | |
—
| | |
N/A
|
| | | | | | | | | | | | | | | | |
|
____________________
|
| (1) |
|
Amounts represent increases (decreases) from current accounting
guidance to previous accounting guidance.
|
| |
|
In addition to construction deferral recognitions, other minor
accounting provisions of ASC 606 had a small impact on HGV’s 2018
results. Table T-3 details the construction deferral recognitions and
other minor accounting provisions contained in the reconciliation in
Table T-19 between the $503 million of 2018 Adjusted EBITDA as reported
under ASC 606 and the $435 million as reported under ASC 605.
|
|
| T-3 |
| Construction Deferrals and Other Items Detail in Bridge |
| Between “As Reported” Results under ASC 606 and Previous
Accounting Guidance |
|
|
|
| Year Ended December 31, 2018 | |
| ($ in millions) | | Construction
Deferrals(1) | |
| Other(2) | |
| Total Effect of
ASC 606 | |
|
Sales of VOIs, net
| |
$
|
(112
|
)
| |
$
|
—
| | |
$
|
(112
|
)
|
|
Sales, marketing, brand and other fees
| | |
—
| | | |
16
| | | |
16
| |
|
Resort and club management
| |
|
—
| | |
|
1
| | |
|
1
| |
|
Total revenues
| | |
(112
|
)
| | |
17
| | | |
(95
|
)
|
| | | | | | | | | | | |
|
|
Cost of VOI sales
| | |
(30
|
)
| | |
—
| | | |
(30
|
)
|
|
Sales and marketing
| | |
(15
|
)
| | |
16
| | | |
1
| |
|
Depreciation and amortization
| |
|
—
| | |
|
2
| | |
|
2
| |
|
Income before income taxes
| | |
(67
|
)
| | |
(1
|
)
| | |
(68
|
)
|
|
Income tax benefit
| |
|
17
| | |
|
—
| | |
|
17
| |
|
Net income
| |
$
|
(50
|
)
| |
$
|
(1
|
)
| |
$
|
(51
|
)
|
| | | | | | | | | | | |
|
|
Net income
| |
$
|
(50
|
)
| |
$
|
(1
|
)
| |
$
|
(51
|
)
|
|
Add back:
| | | | | | | | | | | | |
|
Depreciation and amortization
| | |
—
| | | |
2
| | | |
2
| |
|
Income tax benefit
| |
|
(17
|
)
| |
|
—
| | |
|
(17
|
)
|
| EBITDA | | |
(67
|
)
| | |
1
| | | |
(66
|
)
|
|
Other adjustment items
| |
|
—
| | |
|
(2
|
)
| |
|
(2
|
)
|
| Adjusted EBITDA | |
$
|
(67
|
)
| |
$
|
(1
|
)
| |
$
|
(68
|
)
|
| | | | | | | | | | | |
|
____________________
|
| (1) |
|
During periods of construction, we defer revenues and certain
related direct expenses from the sales of VOIs until construction is
completed.
|
| (2) | |
Includes the following changes under ASC 606 compared to the
previous accounting guidance: (i) revenue for certain sales
incentives is now presented on a net basis as a decrease to both
sales, marketing, brand and other fees and sales and marketing
expense rather than on a gross basis; (ii) expected breakage revenue
from advanced deposits on prepaid vacation packages is recognized
ratably as packages are redeemed rather than upon expiration; and
(iii) key money amortization is presented as a reduction to sales,
marketing, brand and other fees rather than as amortization expense.
|
| |
|
Conference Call
Hilton Grand Vacations will host a conference call on Feb. 28, 2019, at
11 a.m. (EST) to discuss fourth-quarter results. Participants may listen
to the live webcast by logging onto the Hilton Grand Vacations’ Investor
Relations website at http://investors.hgv.com/events-and-presentations.
A replay and transcript of the webcast will be available on HGV’s
Investor Relations website within 24 hours after the live event.
Alternatively, participants may listen to the live call by dialing
1-888-312-3049 in the U.S. or +1-323-794-2112 internationally. Please
use conference ID# 7540297. Participants are encouraged to dial into the
call or link to the webcast at least 20 minutes prior to the scheduled
start time. In the event of audio difficulties during the call on the
toll-free number, participants are advised that accessing the call using
the +1-323-794-2112 dial-in number may bypass the source of the audio
difficulties.
A telephone replay will be available for seven days following the call.
To access the telephone replay, dial 1-888-203-1112 in the U.S. or
+1-719-457-0820 internationally and use conference ID# 7540297.
Forward-Looking Statements
This press release contains forward-looking statements within the
meaning of Section 27A of the Securities Act of 1933, as amended and
Section 21E of the Securities Exchange Act of 1934, as amended.
Forward-looking statements convey management’s expectations as to the
future of HGV, and are based on management’s beliefs, expectations,
assumptions and such plans, estimates, projections and other information
available to management at the time HGV makes such statements.
Forward-looking statements include all statements that are not
historical facts and may be identified by terminology such as the words
“outlook,” “believe,” “expect,” “potential,” “goal,” “continues,” “may,”
“will,” “should,” “could,” “seeks,” “approximately,” “projects,”
predicts,” “intends,” “plans,” “estimates,” “anticipates” “future,”
“guidance,” “target,” or the negative version of these words or other
comparable words. The forward-looking statements contained in this press
release include statements related to HGV’s revenues, earnings, taxes,
cash flow and related financial and operating measures, and expectations
with respect to future operating, financial and business performance,
and other anticipated future events and expectations that are not
historical facts.
HGV cautions you that its forward-looking statements involve known and
unknown risks, uncertainties and other factors, which may cause the
actual results, performance or achievements of HGV to be materially
different from the future results, business performance or achievements
expressed or implied by its forward-looking statements. HGV’s
forward-looking statements are not guarantees of future performance, and
you should not place undue reliance on such statements in this press
release. Factors that could cause HGV’s actual results to differ
materially from those contemplated by its forward-looking statements
include risks associated with: the inherent business, financial and
operating risks of the timeshare industry, including limited
underwriting standards due to the real-time nature of industry sales
practices, and the intense competition associated with the industry;
HGV’s ability successfully market and sell VOIs; HGV’s development and
other activities to source inventory for VOI sales; significant
increases in defaults on HGV’s vacation ownership mortgage receivables;
the ability of managed homeowner associations to collect sufficient
maintenance fees; general volatility in the economy and/or the financial
and credit markets; adverse economic or market conditions and trends in
the tourism and hospitality industry, which may impact the purchasing
and vacationing decisions of consumers; actions of HGV or the occurrence
of other events that could cause a breach under or termination of the
HGV’s license agreement with Hilton that could affect or terminate our
access to the Hilton brands and programs, or actions of Hilton that
affect the reputation of the licensed marks or Hilton’s programs;
economic and operational uncertainties related to HGV’s expanding global
operations, including our ability to manage the outcome and timing of
such operations and compliance with anti-corruption, data privacy and
other applicable laws and regulations affecting our international
operations; the effects of foreign currency exchange; changes in tax
rates and exposure to additional tax liabilities; the impact of future
changes in legislation, regulations or accounting pronouncements; HGV’s
acquisitions, joint ventures, and strategic alliances that may not
result in expected benefits, including the termination of material
fee-for-service agreements; our dependence on third-party development
activities to secure just-in-time inventory; HGV’s use of social media
platforms; cyber-attacks, security vulnerabilities, and information
technology system failures resulting in disclosure of personal data,
company data loss, system outages or disruptions of online services,
which could lead to reduced revenue, increased costs, liability claims,
harm to user engagement, and harm to HGV’s reputation or competitive
position; the impact of claims against HGV that may result in adverse
outcomes, including regulatory proceedings or litigation; HGV’s credit
facilities, indenture and other debt agreements and instruments,
including variable interest rates, operating and financial restrictions,
our ability to make scheduled payments, and our ability to refinance our
debt on acceptable terms; the continued service and availability of key
executives and employees; and catastrophic events or geo-political
conditions including war, terrorist activity, political strife or
natural disasters that may disrupt HGV’s operations in key vacation
destinations. Any one or more of the foregoing factors could adversely
impact HGV’s operations, revenue, operating margins, financial condition
and/or credit rating.
For additional information regarding factors that could cause HGV’s
actual results to differ materially from those expressed or implied in
the forward-looking statements in this press release, please see
the risk factors discussed in “Part I—Item 1A. Risk Factors” of HGV’s
Annual Report on Form 10-K for the fiscal year ended Dec. 31, 2018 and
those described from time to time other periodic reports that we file
with the U.S. Securities and Exchange Commission. There may be other
risks and uncertainties that we are unable to predict at this time or
that we currently do not expect to have a material adverse effect on our
business. Except for HGV’s ongoing obligations to disclose material
information under the federal securities laws, we undertake no
obligation to publicly update or review any forward-looking statement,
whether as a result of new information, future developments, changes in
management’s expectations, or otherwise.
Non-GAAP Financial Measures
The Company refers to certain non-GAAP financial measures in this press
release, including EBITDA, Adjusted EBITDA, Adjusted EBITDA margins,
free cash flow and adjusted free cash flow. Please see the tables in
this press release and “Definitions” for additional information and
reconciliations of such non-GAAP financial measures.
About Hilton Grand Vacations Inc.
Hilton Grand Vacations Inc. (NYSE:HGV) is recognized as a leading global
timeshare company. With headquarters in Orlando, Florida, Hilton Grand
Vacations develops, markets and operates a system of brand-name,
high-quality vacation ownership resorts in select vacation destinations.
The Company also manages and operates two innovative club membership
programs: Hilton Grand Vacations Club® and The Hilton Club®,
providing exclusive exchange, leisure travel and reservation services
for more than 305,000 club members. For more information, visit www.hgv.com
and www.hiltongrandvacations.com.
|
|
HILTON GRAND VACATIONS INC. |
DEFINITIONS |
|
|
EBITDA and Adjusted EBITDA
EBITDA, presented herein, is a financial measure that is not recognized
under U.S. GAAP that reflects net income (loss), before interest expense
(excluding non-recourse debt), a provision for income taxes and
depreciation and amortization.
Adjusted EBITDA, presented herein, is calculated as EBITDA, as
previously defined, further adjusted to exclude certain items,
including, but not limited to, gains, losses and expenses in connection
with: (i) asset dispositions; (ii) foreign currency transactions;
(iii) debt restructurings/retirements; (iv) non-cash impairment losses;
(v) reorganization costs, including severance and relocation costs;
(vi) share-based and certain other compensation expenses; (vii) costs
related to the spin-off; and (viii) other items.
EBITDA and Adjusted EBITDA are not recognized terms under U.S. GAAP and
should not be considered as alternatives to net income (loss) or other
measures of financial performance or liquidity derived in accordance
with U.S. GAAP. In addition, our definitions of EBITDA and Adjusted
EBITDA may not be comparable to similarly titled measures of other
companies.
HGV believes that EBITDA and Adjusted EBITDA provide useful information
to investors about us and our financial condition and results of
operations for the following reasons: (i) EBITDA and Adjusted EBITDA are
among the measures used by our management team to evaluate our operating
performance and make day-to-day operating decisions; and (ii) EBITDA and
Adjusted EBITDA are frequently used by securities analysts, investors
and other interested parties as a common performance measure to compare
results or estimate valuations across companies in our industry. EBITDA
and Adjusted EBITDA have limitations as analytical tools and should not
be considered either in isolation or as a substitute for net income
(loss), cash flow or other methods of analyzing our results as reported
under U.S. GAAP. Some of these limitations are:
-
EBITDA and Adjusted EBITDA do not reflect changes in, or cash
requirements for, our working capital needs;
-
EBITDA and Adjusted EBITDA do not reflect our interest expense
(excluding interest expense on non-recourse debt), or the cash
requirements necessary to service interest or principal payments on
our indebtedness;
-
EBITDA and Adjusted EBITDA do not reflect our tax expense or the cash
requirements to pay our taxes;
-
EBITDA and Adjusted EBITDA do not reflect historical cash expenditures
or future requirements for capital expenditures or contractual
commitments;
-
EBITDA and Adjusted EBITDA do not reflect the effect on earnings or
changes resulting from matters that we consider not to be indicative
of our future operations;
-
EBITDA and Adjusted EBITDA do not reflect any cash requirements for
future replacements of assets that are being depreciated and amortized;
-
EBITDA and Adjusted EBITDA may be calculated differently from other
companies in our industry limiting their usefulness as comparative
measures.
Because of these limitations, EBITDA and Adjusted EBITDA should not be
considered as discretionary cash available to us to reinvest in the
growth of our business or as measures of cash that will be available to
us to meet our obligations.
Real Estate Metrics
Contract sales represents the total amount of VOI products under
purchase agreements signed during the period where HGVhas
received a down payment of at least 10 percent of the contract price.
Contract sales is not a recognized term under U.S. GAAP and should not
be considered in isolation or as an alternative to Sales of VOIs, net or
any other comparable operating measure derived in accordance with U.S.
GAAP. Contract sales differ from revenues from the Sales of VOIs, net
that HGV reports in its consolidated statements of operations due to the
requirements for revenue recognition as described in Note 2: Basis of
Presentation and Summary of Significant Accounting Policies in the
Company’s audited consolidated financial statements, as well as
adjustments for incentives and other administrative fee revenues. HGV
considers contract sales to be an important operating measure because it
reflects the pace of sales in HGV’s business.
Developed Inventory refers to VOI inventory source from projects
the Company develops.
Fee-for-Service Inventory refers to VOI inventory HGV sells and
manages on behalf of first-party developers.
Just-in-Time Inventory refers to VOI inventory primarily sourced
in transactions that are designed to closely correlate thetiming
of the acquisition with HGV’s sale of that inventory to purchasers.
NOG or Net Owner Growth represents the year-over-year change in
membership.
Real estate margin represents sales revenue less the cost of VOI
sales and sales and marketing costs, net of marketing revenue.Real
estate margin percentage is calculated by dividing real estate margin by
sales revenue. HGV considers this to be an important operating measure
because it measures the efficiency of the Company’s sales and marketing
spending and management of inventory costs.
Sales revenue represents sale of VOIs, net and commissions and
brand fees earned from the sale of fee-for-service intervals.
Tour flow represents the number of sales presentations given at
HGV’s sales centers during the period.
Volume per guest (“VPG”) represents the sales attributable to
tours at HGV’s sales locations and is calculated by dividingContract
sales, excluding telesales, by tour flow. The Company considers VPG to
be an important operating measure because it measures the effectiveness
of HGV’s sales process, combining the average transaction price with
closing rate.
Free cash flow represents cash from operating activities adjusted
for share-based compensation, less non-inventory capitalspending.
Adjusted free cash flow represents free cash flow less
non-recourse debt activities, net.
Resort and Club Management and Rental Metrics
Transient rate represents the total rental room revenue for
transient guests divided by total number of transient room nightssold
in a given period and excludes room rentals associated with marketing
programs, owner usage and the redemption of Club Bonus Points.
|
|
| HILTON GRAND VACATIONS INC. |
|
|
| FINANCIAL TABLES |
|
|
|
CONSOLIDATED BALANCE SHEETS
|
|
|
T-4
|
|
CONSOLIDATED STATEMENTS OF OPERATIONS
| | |
T-5
|
|
CONSOLIDATED STATEMENTS OF CASH FLOWS
| | |
T-6
|
|
FREE CASH FLOWS RECONCILIATION
| | |
T-7
|
|
SEGMENT REVENUE RECONCILIATION
| | |
T-8
|
|
SEGMENT EBITDA AND ADJUSTED EBITDA TO NET INCOME
| | |
T-9
|
|
REAL ESTATE SALES MARGIN DETAIL SCHEDULE
| | |
T-10
|
|
FINANCING MARGIN DETAIL SCHEDULE
| | |
T-11
|
|
RESORT AND CLUB MARGIN DETAIL SCHEDULE
| | |
T-12
|
|
RENTAL AND ANCILLARY MARGIN DETAIL SCHEDULE
| | |
T-13
|
|
REAL ESTATE SALES AND FINANCING SEGMENT ADJUSTED EBITDA
| | |
T-14
|
|
RESORT AND CLUB MANAGEMENT SEGMENT ADJUSTED EBITDA
| | |
T-15
|
|
EFFECTS OF NEW ACCOUNTING STANDARD
| | | |
|
CONSOLIDATED STATEMENTS OF OPERATIONS – THREE MONTHS ENDED DECEMBER
31, 2018
| | |
T-16
|
|
CONSOLIDATED STATEMENTS OF OPERATIONS – YEAR ENDED DECEMBER 31, 2018
| | |
T-17
|
|
SEGMENT EBITDA AND ADJUSTED EBITDA TO NET INCOME – THREE MONTHS
ENDED DECEMBER 31, 2018
| | |
T-18
|
|
SEGMENT EBITDA AND ADJUSTED EBITDA TO NET INCOME – YEAR ENDED
DECEMBER 31, 2018
| | |
T-19
|
|
REAL ESTATE MARGIN – THREE MONTHS ENDED DECEMBER 31, 2018
| | |
T-20
|
|
REAL ESTATE MARGIN – YEAR ENDED DECEMBER 31, 2018
| | |
T-21
|
|
FORWARD-YEAR ADJUSTED EBITDA RECONCILIATION
| | |
T-22
|
| | |
|
|
|
| T-4 |
| HILTON GRAND VACATIONS INC. |
| CONSOLIDATED BALANCE SHEETS |
| (in millions, except share data) |
|
|
|
| December 31, |
| | 2018 |
|
| 2017 |
| | | | | | |
|
| ASSETS | | | | | | | |
|
Cash and cash equivalents
| |
$
|
108
| | |
$
|
246
|
|
Restricted cash
| | |
72
| | | |
51
|
|
Accounts receivable, net
| | |
153
| | | |
112
|
|
Timeshare financing receivables, net
| | |
1,120
| | | |
1,071
|
|
Inventory
| | |
527
| | | |
509
|
|
Property and equipment, net
| | |
559
| | | |
238
|
|
Investments in unconsolidated affiliates
| | |
38
| | | |
41
|
|
Intangible assets, net
| | |
81
| | | |
72
|
|
Other assets
| |
|
95
| | |
|
44
|
| TOTAL ASSETS | |
$
|
2,753
| | |
$
|
2,384
|
| LIABILITIES AND EQUITY | | | | | | | |
| Liabilities: | | | | | | | |
|
Accounts payable, accrued expenses and other
| |
$
|
324
| | |
$
|
339
|
|
Advanced deposits
| | |
101
| | | |
104
|
|
Debt, net
| | |
604
| | | |
482
|
|
Non-recourse debt, net
| | |
759
| | | |
583
|
|
Deferred revenues
| | |
95
| | | |
109
|
|
Deferred income tax liabilities
| |
|
254
| | |
|
249
|
| Total liabilities | | |
2,137
| | | |
1,866
|
|
Commitments and Contingencies
| | | | | | | |
| Equity: | | | | | | | |
Preferred stock, $0.01 par value; 300,000,000 authorized shares,
none issued or outstanding as of December 31, 2018 and 2017
| | |
—
| | | |
—
|
Common stock, $0.01 par value; 3,000,000,000 authorized shares,
94,558,086 and 99,136,304 issued and outstanding as of December
31, 2018 and 2017, respectively
| | |
1
| | | |
1
|
|
Additional paid-in capital
| | |
174
| | | |
162
|
|
Accumulated retained earnings
| |
|
441
| | |
|
355
|
| Total equity | |
|
616
| | |
|
518
|
| TOTAL LIABILITIES AND EQUITY | |
$
|
2,753
| | |
$
|
2,384
|
| | | | | | |
|
|
|
| T-5 |
| HILTON GRAND VACATIONS INC. |
| CONSOLIDATED STATEMENTS OF OPERATIONS |
| (in millions, except share data) |
|
|
|
| Three Months Ended
December 31, | |
| Year Ended
December 31, | |
| | 2018 | |
| 2017 | | | 2018 | |
| 2017 | |
| Revenues | | | | | | | | | | | | | | | | |
|
Sales of VOIs, net
| |
$
|
307
| | |
$
|
142
| | |
$
|
734
| | |
$
|
548
| |
|
Sales, marketing, brand and other fees
| | |
147
| | | |
143
| | | |
570
| | | |
544
| |
|
Financing
| | |
41
| | | |
38
| | | |
158
| | | |
147
| |
|
Resort and club management
| | |
56
| | | |
50
| | | |
172
| | | |
158
| |
|
Rental and ancillary services
| | |
54
| | | |
41
| | | |
218
| | | |
179
| |
|
Cost reimbursements
| |
|
37
| | |
|
33
| | |
|
147
| | |
|
135
| |
|
Total revenues
| |
|
642
| | |
|
447
| | |
|
1,999
| | |
|
1,711
| |
| Expenses | | | | | | | | | | | | | | | | |
|
Cost of VOI sales
| | |
101
| | | |
41
| | | |
210
| | | |
148
| |
|
Sales and marketing
| | |
200
| | | |
171
| | | |
728
| | | |
663
| |
|
Financing
| | |
14
| | | |
11
| | | |
49
| | | |
43
| |
|
Resort and club management
| | |
14
| | | |
11
| | | |
47
| | | |
43
| |
|
Rental and ancillary services
| | |
38
| | | |
34
| | | |
133
| | | |
122
| |
|
General and administrative
| | |
33
| | | |
29
| | | |
117
| | | |
104
| |
|
Depreciation and amortization
| | |
11
| | | |
8
| | | |
36
| | | |
29
| |
|
License fee expense
| | |
25
| | | |
22
| | | |
98
| | | |
87
| |
|
Cost reimbursements
| |
|
37
| | |
|
33
| | |
|
147
| | |
|
135
| |
|
Total operating expenses
| | |
473
| | | |
360
| | | |
1,565
| | | |
1,374
| |
|
Interest expense
| | |
(8
|
)
| | |
(6
|
)
| | |
(30
|
)
| | |
(27
|
)
|
|
Equity in earnings from unconsolidated affiliates
| | |
—
| | | |
—
| | | |
—
| | | |
1
| |
|
Other loss, net
| |
|
—
| | |
|
(1
|
)
| |
|
(1
|
)
| |
|
—
| |
| Income before income taxes | | |
161
| | | |
80
| | | |
403
| | | |
311
| |
|
Income tax (expense) benefit
| |
|
(41
|
)
| |
|
103
| | |
|
(105
|
)
| |
|
16
| |
| Net income | |
$
|
120
| | |
$
|
183
| | |
$
|
298
| | |
$
|
327
| |
| Earnings per share: | | | | | | | | | | | | | | | | |
|
Basic
| |
$
|
1.25
| | |
$
|
1.85
| | |
$
|
3.07
| | |
$
|
3.30
| |
|
Diluted
| |
$
|
1.24
| | |
$
|
1.83
| | |
$
|
3.05
| | |
$
|
3.28
| |
| | | | | | | | | | | | | | | |
|
|
|
| T-6 |
| HILTON GRAND VACATIONS INC. |
| CONSOLIDATED STATEMENTS OF CASH FLOWS |
| (in millions) |
|
|
|
| Three Months Ended
December 31, | |
| Year Ended December 31, | |
| | 2018 | |
| 2017 | | | 2018 | |
| 2017 | |
| Operating Activities | | | | | | | | | | | | | | | | |
|
Net income
| |
$
|
120
| | |
$
|
183
| | |
$
|
298
| | |
$
|
327
| |
|
Adjustments to reconcile net income to net cash provided by (used
in) operating activities:
| | | | | | | | | | | | | | | | |
|
Depreciation and amortization
| | |
11
| | | |
8
| | | |
36
| | | |
29
| |
|
Amortization of cost to obtain a contract
| | |
2
| | | |
—
| | | |
2
| | | |
—
| |
|
Amortization of deferred financing costs and other
| | |
1
| | | |
1
| | | |
5
| | | |
5
| |
|
Provision for loan losses
| | |
19
| | | |
13
| | | |
69
| | | |
58
| |
|
Other loss, net
| | |
—
| | | |
1
| | | |
1
| | | |
—
| |
|
Share-based compensation
| | |
3
| | | |
2
| | | |
16
| | | |
15
| |
|
Deferred income tax expense (benefit)
| | |
41
| | | |
(124
|
)
| | |
20
| | | |
(129
|
)
|
|
Equity in earnings from unconsolidated affiliates
| | |
—
| | | |
—
| | | |
—
| | | |
(1
|
)
|
|
Distributions received from unconsolidated affiliates
| | |
—
| | | |
—
| | | |
2
| | | |
—
| |
|
Net changes in assets and liabilities:
| | | | | | | | | | | | | | | | |
|
Accounts receivable, net
| | |
(2
|
)
| | |
(7
|
)
| | |
(41
|
)
| | |
12
| |
|
Timeshare financing receivables, net
| | |
(35
|
)
| | |
(28
|
)
| | |
(118
|
)
| | |
(103
|
)
|
|
Inventory
| | |
31
| | | |
9
| | | |
16
| | | |
47
| |
|
Purchase of real estate for future conversion to inventory
| | |
—
| | | |
—
| | | |
(299
|
)
| | |
—
| |
|
Other assets
| | |
30
| | | |
7
| | | |
(31
|
)
| | |
(4
|
)
|
|
Accounts payable, accrued expenses and other
| | |
(9
|
)
| | |
(1
|
)
| | |
(24
|
)
| | |
95
| |
|
Advanced deposits
| | |
1
| | | |
2
| | | |
14
| | | |
1
| |
|
Deferred revenues
| | |
(168
|
)
| | |
(10
|
)
| | |
(126
|
)
| | |
3
| |
|
Other
| |
|
1
| | |
|
1
| | |
|
1
| | |
|
1
| |
|
Net cash provided by (used in) operating activities
| |
|
46
| | |
|
57
| | |
|
(159
|
)
| |
|
356
| |
| Investing Activities | | | | | | | | | | | | | | | | |
|
Capital expenditures for property and equipment
| | |
(15
|
)
| | |
(10
|
)
| | |
(44
|
)
| | |
(35
|
)
|
|
Software capitalization costs
| | |
(7
|
)
| | |
—
| | | |
(19
|
)
| | |
(12
|
)
|
|
Return of investment from unconsolidated affiliates
| | |
—
| | | |
—
| | | |
11
| | | |
—
| |
|
Investment in unconsolidated affiliates
| |
|
(5
|
)
| |
|
—
| | |
|
(10
|
)
| |
|
(40
|
)
|
|
Net cash used in investing activities
| |
|
(27
|
)
| |
|
(10
|
)
| |
|
(62
|
)
| |
|
(87
|
)
|
| Financing Activities | | | | | | | | | | | | | | | | |
|
Issuance of debt
| | |
315
| | | |
—
| | | |
530
| | | |
—
| |
|
Issuance of non-recourse debt
| | |
—
| | | |
—
| | | |
663
| | | |
350
| |
|
Repurchase and retirement of common stock
| | |
(71
|
)
| | |
—
| | | |
(183
|
)
| | |
—
| |
|
Repayment of debt
| | |
(240
|
)
| | |
(3
|
)
| | |
(408
|
)
| | |
(10
|
)
|
|
Repayment of non-recourse debt
| | |
(49
|
)
| | |
(31
|
)
| | |
(485
|
)
| | |
(459
|
)
|
|
Debt issuance costs
| | |
(6
|
)
| | |
—
| | | |
(12
|
)
| | |
(5
|
)
|
|
Proceeds from stock options exercises
| | |
—
| | | |
—
| | | |
—
| | | |
1
| |
|
Payment of withholding taxes on vesting of restricted stock units
| | |
—
| | | |
—
| | | |
(4
|
)
| | |
—
| |
|
Capital contribution
| |
|
—
| | |
|
—
| | |
|
3
| | |
|
—
| |
|
Net cash (used in) provided by financing activities
| |
|
(51
|
)
| |
|
(34
|
)
| |
|
104
| | |
|
(123
|
)
|
| Net increase (decrease) in cash, cash equivalents and restricted
cash | | |
(32
|
)
| | |
13
| | | |
(117
|
)
| | |
146
| |
| Cash, cash equivalents and restricted cash, beginning of period | |
|
212
| | |
|
284
| | |
|
297
| | |
|
151
| |
| Cash, cash equivalents and restricted cash, end of period | |
$
|
180
| | |
$
|
297
| | |
$
|
180
| | |
$
|
297
| |
| | | | | | | | | | | | | | | |
|
|
|
| T-7 |
| HILTON GRAND VACATIONS INC. |
| FREE CASH FLOWS RECONCILIATION |
| (in millions) |
|
|
|
| Three Months Ended
December 31, | |
| Year Ended December 31, | |
| | 2018 | |
| 2017 | | | 2018 | |
| 2017 | |
| Cash Flow provided by (used in) operations | |
$
|
46
| | |
$
|
57
| | |
$
|
(159
|
)
| |
$
|
356
| |
|
Capital expenditures for property and equipment
| | |
(15
|
)
| | |
(10
|
)
| | |
(44
|
)
| | |
(35
|
)
|
|
Software capitalization costs
| |
|
(7
|
)
| |
|
—
| | |
|
(19
|
)
| |
|
(12
|
)
|
| Free Cash Flow | | |
24
| | | |
47
| | | |
(222
|
)
| | |
309
| |
|
Non-recourse debt activity, net
| |
|
(49
|
)
| |
|
(31
|
)
| |
|
178
| | |
|
(109
|
)
|
| Adjusted Free Cash Flow | |
$
|
(25
|
)
| |
$
|
16
| | |
$
|
(44
|
)
| |
$
|
200
| |
| | | | | | | | | | | | | | | |
|
|
|
| T-8 |
| HILTON GRAND VACATIONS INC. |
| SEGMENT REVENUE RECONCILIATION |
| (in millions) |
|
|
|
| Three Months Ended
December 31, | |
| Year Ended December 31, | |
| | 2018 | |
| 2017 | | | 2018 | |
| 2017 | |
| Revenues: | | | | | | | | | | | | | | | | |
|
Real estate sales and financing
| |
$
|
495
| | |
$
|
323
| | |
$
|
1,462
| | |
$
|
1,239
| |
|
Resort operations and club management
| |
|
118
| | |
|
97
| | |
|
422
| | |
|
367
| |
|
Segment revenues
| | |
613
| | | |
420
| | | |
1,884
| | | |
1,606
| |
|
Cost reimbursements
| | |
37
| | | |
33
| | | |
147
| | | |
135
| |
|
Intersegment eliminations
| |
|
(8
|
)
| |
|
(6
|
)
| |
|
(32
|
)
| |
|
(30
|
)
|
| Total revenues | |
$
|
642
| | |
$
|
447
| | |
$
|
1,999
| | |
$
|
1,711
| |
| | | | | | | | | | | | | | | |
|
|
|
| T-9 |
| HILTON GRAND VACATIONS INC. |
| SEGMENT EBITDA AND ADJUSTED EBITDA TO NET INCOME |
| (in millions) |
|
| | |
| | |
| | Three Months Ended
December 31, | | | Year Ended December 31, | |
| | 2018 | |
| 2017 | | | 2018 | |
| 2017 | |
| Net Income | |
$
|
120
| | |
$
|
183
| | |
$
|
298
| | |
$
|
327
| |
|
Interest expense
| | |
8
| | | |
6
| | | |
30
| | | |
27
| |
|
Income tax expense (benefit)
| | |
41
| | | |
(103
|
)
| | |
105
| | | |
(16
|
)
|
|
Depreciation and amortization
| | |
11
| | | |
8
| | | |
36
| | | |
29
| |
Interest expense, depreciation and amortization included in equity
in earnings from unconsolidated affiliates
| |
|
1
| | |
|
1
| | |
|
4
| | |
|
3
| |
| EBITDA | | |
181
| | | |
95
| | | |
473
| | | |
370
| |
|
Other loss, net
| | |
—
| | | |
1
| | | |
1
| | | |
—
| |
|
Share-based compensation expense
| | |
3
| | | |
2
| | | |
16
| | | |
15
| |
|
Other adjustment items (1) | |
|
2
| | |
|
3
| | |
|
13
| | |
|
10
| |
| Adjusted EBITDA | |
$
|
186
| | |
$
|
101
| | |
$
|
503
| | |
$
|
395
| |
| | | | | | | | | | | | | | | |
|
| Adjusted EBITDA: | | | | | | | | | | | | | | | | |
|
Real estate sales and financing (2) | |
$
|
173
| | |
$
|
96
| | |
$
|
447
| | |
$
|
359
| |
|
Resort operations and club management (2) | |
|
66
| | |
|
51
| | |
|
245
| | |
|
204
| |
|
Segment Adjusted EBITDA
| | |
239
| | | |
147
| | | |
692
| | | |
563
| |
|
Adjustments:
| | | | | | | | | | | | | | | | |
|
Adjusted EBITDA from unconsolidated affiliates
| | |
1
| | | |
1
| | | |
4
| | | |
4
| |
|
License fee expense
| | |
(25
|
)
| | |
(22
|
)
| | |
(98
|
)
| | |
(87
|
)
|
|
General and administrative (3) | |
|
(29
|
)
| |
|
(25
|
)
| |
|
(95
|
)
| |
|
(85
|
)
|
| Adjusted EBITDA | |
$
|
186
| | |
$
|
101
| | |
$
|
503
| | |
$
|
395
| |
|
Adjusted EBITDA margin %
| | |
29.0
|
%
| | |
22.6
|
%
| | |
25.2
|
%
| | |
23.1
|
%
|
|
EBITDA margin %
| | |
28.2
|
%
| | |
21.3
|
%
| | |
23.7
|
%
| | |
21.6
|
%
|
__________________
|
| (1) |
|
Includes costs associated with the spin-off transaction of $2
million and $3 million for the three months ended Dec. 31, 2018 and
2017, respectively, and $11 million and $8 million for the years
ended Dec. 31, 2018 and 2017, respectively.
|
| (2) | |
Includes intersegment eliminations, share-based compensation
attributable to the segment and other adjustments.
|
| (3) | |
Excludes share-based compensation and other adjustment items.
|
| |
|
|
|
| T-10 |
| HILTON GRAND VACATIONS INC. |
| REAL ESTATE SALES MARGIN DETAIL SCHEDULE |
| (in millions, except Tour Flow and VPG) |
|
| | |
| | |
| | Three Months Ended
December 31, | | | Year Ended December 31, | |
| | 2018 | |
| 2017 | | | 2018 | |
| 2017 | |
|
Contract sales
| |
$
|
360
| | |
$
|
339
| | |
$
|
1,410
| | |
$
|
1,275
| |
|
Tour flow
| | |
91,076
| | | |
83,910
| | | |
357,861
| | | |
330,775
| |
|
VPG
| |
$
|
3,775
| | |
$
|
3,854
| | |
$
|
3,743
| | |
$
|
3,657
| |
|
Owned contract sales mix
| | |
43.9
|
%
| | |
45.1
|
%
| | |
45.0
|
%
| | |
45.6
|
%
|
|
Fee-for-service contract sales mix
| | |
56.1
|
%
| | |
54.9
|
%
| | |
55.0
|
%
| | |
54.4
|
%
|
|
Sales of VOIs, net
| |
$
|
307
| | |
$
|
142
| | |
$
|
734
| | |
$
|
548
| |
|
Adjustments:
| | | | | | | | | | | | | | | | |
|
Fee-for-service sales (1) | | |
202
| | | |
186
| | | |
776
| | | |
694
| |
|
Loan loss provision
| | |
19
| | | |
13
| | | |
69
| | | |
58
| |
|
Reportability and other:
| | | | | | | | | | | | | | | | |
|
Deferrals of Sales of VOIs under construction(2) | | |
(153
|
)
| | |
1
| | | |
(133
|
)
| | |
5
| |
|
Fee-for-service sale upgrades, net
| | |
(23
|
)
| | |
(13
|
)
| | |
(63
|
)
| | |
(52
|
)
|
|
Other (3) | |
|
8
| | |
|
10
| | |
|
27
| | |
|
22
| |
|
Contract sales
| |
$
|
360
| | |
$
|
339
| | |
$
|
1,410
| | |
$
|
1,275
| |
|
Sales of VOIs, net
| |
$
|
307
| | |
$
|
142
| | |
$
|
734
| | |
$
|
548
| |
|
Sales, marketing, brand and other fees
| | |
147
| | | |
143
| | | |
570
| | | |
544
| |
|
Less:
| | | | | | | | | | | | | | | | |
|
Marketing revenue and other fees
| |
|
32
| | |
|
36
| | |
|
123
| | |
|
145
| |
|
Sales revenue
| | |
422
| | | |
249
| | | |
1,181
| | | |
947
| |
|
Less:
| | | | | | | | | | | | | | | | |
|
Cost of VOI sales
| | |
101
| | | |
41
| | | |
210
| | | |
148
| |
|
Sales and marketing expense, net (4) | |
|
162
| | |
|
128
| | |
|
575
| | |
|
492
| |
| Real estate margin | |
$
|
159
| | |
$
|
80
| | |
$
|
396
| | |
$
|
307
| |
|
Real estate margin percentage
| | |
37.7
|
%
| | |
32.1
|
%
| | |
33.5
|
%
| | |
32.4
|
%
|
__________________
|
| (1) |
|
Represents contract sales from fee-for-service properties on which
the Company earns commissions and brand fees.
|
| (2) | |
Includes $112 million cumulative effect of applying ASC 606 for the
year ended Dec. 31, 2018.
|
| (3) | |
Includes adjustments for revenue recognition, including amounts in
rescission and sales incentives.
|
| (4) | |
Includes revenue recognized through our marketing programs for
existing owners and prospective first-time buyers and revenue
associated with sales incentives and document compliance.
|
| |
|
|
|
| T-11 |
| HILTON GRAND VACATIONS INC. |
| FINANCING MARGIN DETAIL SCHEDULE |
| (in millions) |
|
| | |
| | |
| | Three Months Ended
December 31, | | | Year Ended December 31, | |
| | 2018 | |
| 2017 | | | 2018 | |
| 2017 | |
|
Interest income
| |
$
|
37
| | |
$
|
35
| | |
$
|
140
| | |
$
|
132
| |
|
Other financing revenue
| |
|
4
| | |
|
3
| | |
|
18
| | |
|
15
| |
|
Financing revenue
| |
|
41
| | |
|
38
| | |
|
158
| | |
|
147
| |
|
Consumer financing interest expense
| | |
8
| | | |
4
| | | |
24
| | | |
20
| |
|
Other financing expense
| |
|
6
| | |
|
7
| | |
|
25
| | |
|
23
| |
|
Financing expense
| |
|
14
| | |
|
11
| | |
|
49
| | |
|
43
| |
| Financing margin | |
$
|
27
| | |
$
|
27
| | |
$
|
109
| | |
$
|
104
| |
|
Financing margin percentage
| | |
65.9
|
%
| | |
71.1
|
%
| | |
69.0
|
%
| | |
70.7
|
%
|
| | | | | | | | | | | | | | | |
|
|
|
| T-12 |
| HILTON GRAND VACATIONS INC. |
| RESORT AND CLUB MARGIN DETAIL SCHEDULE |
| (in millions, except for Members and Net Owner Growth) |
|
| | |
| | |
| | Three Months Ended
December 31, | | | Year Ended December 31, | |
| | 2018 | |
| 2017 | | | 2018 | |
| 2017 | |
|
Members
| | | | | | | | | | |
308,637
| | | |
288,391
| |
|
Net Owner Growth (NOG) (1) | | | | | | | | | | |
20,246
| | | |
19,272
| |
|
Net Owner Growth % (NOG%)
| | | | | | | | | | |
7.0
|
%
| | |
7.2
|
%
|
|
Club management revenue
| |
$
|
41
| | |
$
|
36
| | |
$
|
112
| | |
$
|
99
| |
|
Resort management revenue
| |
|
15
| | |
|
14
| | |
|
60
| | |
|
59
| |
|
Resort and club management revenues
| |
|
56
| | |
|
50
| | |
|
172
| | |
|
158
| |
|
Club management expense
| | |
10
| | | |
7
| | | |
29
| | | |
25
| |
|
Resort management expense
| |
|
4
| | |
|
4
| | |
|
18
| | |
|
18
| |
|
Resort and club management expenses
| |
|
14
| | |
|
11
| | |
|
47
| | |
|
43
| |
| Resort and club management margin | |
$
|
42
| | |
$
|
39
| | |
$
|
125
| | |
$
|
115
| |
|
Resort and club management margin percentage
| | |
75.0
|
%
| | |
78.0
|
%
| | |
72.7
|
%
| | |
72.8
|
%
|
__________________
|
| (1) |
|
Net Owner Growth over the last twelve months.
|
| |
|
|
|
| T-13 |
| HILTON GRAND VACATIONS INC. |
| RENTAL AND ANCILLARY MARGIN DETAIL SCHEDULE |
| (in millions) |
|
| | |
| | |
| | Three Months Ended
December 31, | | | Year Ended December 31, | |
| | 2018 | |
| 2017 | | | 2018 | |
| 2017 | |
|
Rental revenues
| |
$
|
47
| | |
$
|
36
| | |
$
|
191
| | |
$
|
156
| |
|
Ancillary services revenues
| |
|
7
| | |
|
5
| | |
|
27
| | |
|
23
| |
|
Rental and ancillary services revenues
| |
|
54
| | |
|
41
| | |
|
218
| | |
|
179
| |
|
Rental expenses
| | |
32
| | | |
30
| | | |
110
| | | |
103
| |
|
Ancillary services expense
| |
|
6
| | |
|
4
| | |
|
23
| | |
|
19
| |
|
Rental and ancillary services expenses
| |
|
38
| | |
|
34
| | |
|
133
| | |
|
122
| |
| Rental and ancillary services margin | |
$
|
16
| | |
$
|
7
| | |
$
|
85
| | |
$
|
57
| |
|
Rental and ancillary services margin percentage
| | |
29.6
|
%
| | |
17.1
|
%
| | |
39.0
|
%
| | |
31.8
|
%
|
| | | | | | | | | | | | | | | |
|
|
|
| T-14 |
| HILTON GRAND VACATIONS INC. |
| REAL ESTATE SALES AND FINANCING SEGMENT ADJUSTED EBITDA |
| (in millions) |
|
| | |
| | |
| | Three Months Ended | | | Year Ended | |
| | December 31, | | | December 31, | |
| | 2018 | |
| 2017 | | | 2018 | |
| 2017 | |
|
Sales of VOIs, net
| |
$
|
307
| | |
$
|
142
| | |
$
|
734
| | |
$
|
548
| |
|
Sales, marketing, brand and other fees
| | |
147
| | | |
143
| | | |
570
| | | |
544
| |
|
Financing
| |
|
41
| | |
|
38
| | |
|
158
| | |
|
147
| |
| Real estate sales and financing segment revenues | | |
495
| | | |
323
| | | |
1,462
| | | |
1,239
| |
|
Cost of VOI sales
| | |
(101
|
)
| | |
(41
|
)
| | |
(210
|
)
| | |
(148
|
)
|
|
Sales and marketing
| | |
(200
|
)
| | |
(171
|
)
| | |
(728
|
)
| | |
(663
|
)
|
|
Financing
| | |
(14
|
)
| | |
(11
|
)
| | |
(49
|
)
| | |
(43
|
)
|
|
Marketing package sales
| | |
(7
|
)
| | |
(6
|
)
| | |
(31
|
)
| | |
(29
|
)
|
|
Model unit rental
| | |
(1
|
)
| | |
—
| | | |
(1
|
)
| | |
(1
|
)
|
|
Share-based compensation
| | |
1
| | | |
—
| | | |
3
| | | |
2
| |
|
Other adjustment items
| |
|
—
| | |
|
2
| | |
|
1
| | |
|
2
| |
| Real estate sales and financing segment Adjusted EBITDA | |
$
|
173
| | |
$
|
96
| | |
$
|
447
| | |
$
|
359
| |
|
Real estate sales and financing segment Adjusted EBITDA margin
percentage
| | |
34.9
|
%
| | |
29.7
|
%
| | |
30.6
|
%
| | |
29.0
|
%
|
| | | | | | | | | | | | | | | |
|
|
|
| T-15 |
| HILTON GRAND VACATIONS INC. |
| RESORT AND CLUB MANAGEMENT SEGMENT ADJUSTED EBITDA |
| (in millions) |
|
| | |
| | |
| | Three Months Ended | | | Year Ended | |
| | December 31, | | | December 31, | |
| | 2018 | |
| 2017 | | | 2018 | |
| 2017 | |
|
Resort and club management
| |
$
|
56
| | |
$
|
50
| | |
$
|
172
| | |
$
|
158
| |
|
Rental and ancillary services
| | |
54
| | | |
41
| | | |
218
| | | |
179
| |
|
Marketing package sales
| | |
7
| | | |
6
| | | |
31
| | | |
29
| |
|
Model unit rental
| |
|
1
| | |
|
—
| | |
|
1
| | |
|
1
| |
| Resort and club management segment revenue | | |
118
| | | |
97
| | | |
422
| | | |
367
| |
|
Resort and club management
| | |
(14
|
)
| | |
(11
|
)
| | |
(47
|
)
| | |
(43
|
)
|
|
Rental and ancillary services
| | |
(38
|
)
| | |
(34
|
)
| | |
(133
|
)
| | |
(122
|
)
|
|
Share-based compensation expense
| | |
—
| | | |
(1
|
)
| | |
2
| | | |
2
| |
|
Other adjustment items
| |
|
—
| | |
|
—
| | |
|
1
| | |
|
—
| |
| Resort and club segment Adjusted EBITDA | |
$
|
66
| | |
$
|
51
| | |
$
|
245
| | |
$
|
204
| |
|
Resort and club management segment Adjusted EBITDA margin percentage
| | |
55.9
|
%
| | |
52.6
|
%
| | |
58.1
|
%
| | |
55.6
|
%
|
| | | | | | | | | | | | | | | |
|
|
|
Supplemental Information on the Adoption of ASC 606 |
|
|
|
The following tables provide supplemental information on our
consolidated statement of operations, Adjusted EBITDA and real
estate margin for the three months and year ended Dec. 31, 2018,
compared to the previous accounting guidance.
|
|
|
|
|
| T-16 |
| HILTON GRAND VACATIONS INC. |
| NEW ACCOUNTING STANDARD ADOPTION – EFFECT ON THE THREE MONTHS
ENDED DECEMBER 31, 2018 |
| CONSOLIDATED STATEMENTS OF OPERATIONS |
| (in millions, except per share amounts) |
|
| | |
| | | |
| | Three Months Ended December 31, 2018 | | | | | |
| | As Reported | |
| Effects of
ASC 606 | |
| Previous
Accounting
Guidance | | | Three
Months
Ended
December
31,
2017 | |
| Revenues | | | | | | | | | | | | | | | | |
|
Sales of VOIs, net
| |
$
|
307
| | |
$
|
(142
|
)
| |
$
|
165
| | |
$
|
142
| |
|
Sales, marketing, brand and other fees
| | |
147
| | | |
12
| | | |
159
| | | |
143
| |
|
Financing
| | |
41
| | | |
—
| | | |
41
| | | |
38
| |
|
Resort and club management
| | |
56
| | | |
1
| | | |
57
| | | |
50
| |
|
Rental and ancillary services
| | |
54
| | | |
—
| | | |
54
| | | |
41
| |
|
Cost reimbursements
| |
|
37
| | |
|
—
| | |
|
37
| | |
|
33
| |
|
Total revenues
| |
|
642
| | |
|
(129
|
)
| |
|
513
| | |
|
447
| |
| Expenses | | | | | | | | | | | | | | | | |
|
Cost of VOI sales
| | |
101
| | | |
(46
|
)
| | |
55
| | | |
41
| |
|
Sales and marketing
| | |
200
| | | |
(13
|
)
| | |
187
| | | |
171
| |
|
Financing
| | |
14
| | | |
—
| | | |
14
| | | |
11
| |
|
Resort and club management
| | |
14
| | | |
—
| | | |
14
| | | |
11
| |
|
Rental and ancillary services
| | |
38
| | | |
—
| | | |
38
| | | |
34
| |
|
General and administrative
| | |
33
| | | |
—
| | | |
33
| | | |
29
| |
|
Depreciation and amortization
| | |
11
| | | |
2
| | | |
13
| | | |
8
| |
|
License fee expense
| | |
25
| | | |
—
| | | |
25
| | | |
22
| |
|
Cost reimbursements
| |
|
37
| | |
|
—
| | |
|
37
| | |
|
33
| |
|
Total operating expenses
| | |
473
| | | |
(57
|
)
| | |
416
| | | |
360
| |
|
Interest expense
| | |
(8
|
)
| | |
—
| | | |
(8
|
)
| | |
(6
|
)
|
|
Other loss, net
| |
|
—
| | |
|
—
| | |
|
—
| | |
|
(1
|
)
|
| Income before income taxes | | |
161
| | | |
(72
|
)
| | |
89
| | | |
80
| |
|
Income tax (expense) benefit
| |
|
(41
|
)
| |
|
18
| | |
|
(23
|
)
| |
|
103
| |
| Net income | |
$
|
120
| | |
$
|
(54
|
)
| |
$
|
66
| | |
$
|
183
| |
| Earnings per share: | | | | | | | | | | | | | | | | |
|
Basic
| |
$
|
1.25
| | |
$
|
(0.56
|
)
| |
$
|
0.69
| | |
$
|
1.85
| |
|
Diluted
| |
$
|
1.24
| | |
$
|
(0.55
|
)
| |
$
|
0.69
| | |
$
|
1.83
| |
| | | | | | | | | | | | | | | |
|
|
|
| | |
|
| | | |
| T-17 |
| HILTON GRAND VACATIONS INC. |
| NEW ACCOUNTING STANDARD ADOPTION – EFFECT ON THE YEAR ENDED
DECEMBER 31, 2018 |
| CONSOLIDATED STATEMENTS OF OPERATIONS |
| (in millions, except per share amounts) |
| | | | | | | | |
|
| | | Year Ended December 31, 2018 | | | | | | |
| | | As Reported | |
|
| Effects of ASC 606 | |
|
| Previous Accounting Guidance | | | | Year Ended December 31, 2017 | |
| Revenues | | | | | | | | | | | | | | | | | | | | |
|
Sales of VOIs, net
| | |
$
|
734
| | | |
$
|
(112
|
)
| | |
$
|
622
| | | |
$
|
548
| |
|
Sales, marketing, brand and other fees
| | | |
570
| | | | |
16
| | | | |
586
| | | | |
544
| |
|
Financing
| | | |
158
| | | | |
—
| | | | |
158
| | | | |
147
| |
|
Resort and club management
| | | |
172
| | | | |
1
| | | | |
173
| | | | |
158
| |
|
Rental and ancillary services
| | | |
218
| | | | |
—
| | | | |
218
| | | | |
179
| |
|
Cost reimbursements
| | |
|
147
| | | |
|
—
| | | |
|
147
| | | |
|
135
| |
|
Total revenues
| | |
|
1,999
| | | |
|
(95
|
)
| | |
|
1,904
| | | |
|
1,711
| |
| Expenses | | | | | | | | | | | | | | | | | | | | |
|
Cost of VOI sales
| | | |
210
| | | | |
(30
|
)
| | | |
180
| | | | |
148
| |
|
Sales and marketing
| | | |
728
| | | | |
1
| | | | |
729
| | | | |
663
| |
|
Financing
| | | |
49
| | | | |
—
| | | | |
49
| | | | |
43
| |
|
Resort and club management
| | | |
47
| | | | |
—
| | | | |
47
| | | | |
43
| |
|
Rental and ancillary services
| | | |
133
| | | | |
—
| | | | |
133
| | | | |
122
| |
|
General and administrative
| | | |
117
| | | | |
—
| | | | |
117
| | | | |
104
| |
|
Depreciation and amortization
| | | |
36
| | | | |
2
| | | | |
38
| | | | |
29
| |
|
License fee expense
| | | |
98
| | | | |
—
| | | | |
98
| | | | |
87
| |
|
Cost reimbursements
| | |
|
147
| | | |
|
—
| | | |
|
147
| | | |
|
135
| |
|
Total operating expenses
| | | |
1,565
| | | | |
(27
|
)
| | | |
1,538
| | | | |
1,374
| |
|
Interest expense
| | | |
(30
|
)
| | | |
—
| | | | |
(30
|
)
| | | |
(27
|
)
|
|
Equity in earnings from unconsolidated affiliates
| | | |
—
| | | | |
—
| | | | |
—
| | | | |
1
| |
|
Other loss, net
| | |
|
(1
|
)
| | |
|
—
| | | |
|
(1
|
)
| | |
|
—
| |
| Income before income taxes | | | |
403
| | | | |
(68
|
)
| | | |
335
| | | | |
311
| |
|
Income tax (expense) benefit
| | |
|
(105
|
)
| | |
|
17
| | | |
|
(88
|
)
| | |
|
16
| |
| Net income | | |
$
|
298
| | | |
$
|
(51
|
)
| | |
$
|
247
| | | |
$
|
327
| |
| Earnings per share: | | | | | | | | | | | | | | | | | | | | |
|
Basic
| | |
$
|
3.07
| | | |
$
|
(0.53
|
)
| | |
$
|
2.54
| | | |
$
|
3.30
| |
|
Diluted
| | |
$
|
3.05
| | | |
$
|
(0.53
|
)
| | |
$
|
2.52
| | | |
$
|
3.28
| |
| | | | | | | | | | | | | | | | | | | |
|
|
|
| T-18 |
| HILTON GRAND VACATIONS INC. |
| NEW ACCOUNTING STANDARD ADOPTION – EFFECT ON THE THREE MONTHS
ENDED DECEMBER 31, 2018 |
| SEGMENT EBITDA AND ADJUSTED EBITDA TO NET INCOME |
| (in millions) |
|
|
|
|
| Three Months Ended December 31, 2018 | |
|
| | | |
| | | As Reported | |
|
| Effects of ASC 606 | |
|
| Previous Accounting Guidance | | | | Three Months Ended December 31, 2017 | |
| Net Income | | |
$
|
120
| | | |
$
|
(54
|
)
| | |
$
|
66
| | | |
$
|
183
| |
|
Interest expense
| | | |
8
| | | | |
—
| | | | |
8
| | | | |
6
| |
|
Income tax expense (benefit)
| | | |
41
| | | | |
(18
|
)
| | | |
23
| | | | |
(103
|
)
|
|
Depreciation and amortization
| | | |
11
| | | | |
2
| | | | |
13
| | | | |
8
| |
Interest expense, depreciation and amortization included in equity
from unconsolidated affiliates
| | |
|
1
| | | |
|
—
| | | |
|
1
| | | |
|
1
| |
| EBITDA | | | |
181
| | | | |
(70
|
)
| | | |
111
| | | | |
95
| |
|
Other loss, net
| | | |
—
| | | | |
—
| | | | |
—
| | | | |
1
| |
|
Share-based compensation expense
| | | |
3
| | | | |
—
| | | | |
3
| | | | |
2
| |
|
Other adjustment items (1) | | |
|
2
| | | |
|
(2
|
)
| | |
|
—
| | | |
|
3
| |
| Adjusted EBITDA | | |
$
|
186
| | | |
$
|
(72
|
)
| | |
$
|
114
| | | |
$
|
101
| |
| | | | | | | | | | | | | | | | | | | |
|
| Adjusted EBITDA: | | | | | | | | | | | | | | | | | | | | |
|
Real estate sales and financing (2) | | |
$
|
173
| | | |
$
|
(72
|
)
| | |
$
|
101
| | | |
$
|
96
| |
|
Resort operations and club management (2) | | |
|
66
| | | |
|
—
| | | |
|
66
| | | |
|
51
| |
|
Segment Adjusted EBITDA
| | | |
239
| | | | |
(72
|
)
| | | |
167
| | | | |
147
| |
|
Adjustments:
| | | | | | | | | | | | | | | | | | | | |
|
Adjusted EBITDA from unconsolidated affiliates
| | | |
1
| | | | |
—
| | | | |
1
| | | | |
1
| |
|
License fee expense
| | | |
(25
|
)
| | | |
—
| | | | |
(25
|
)
| | | |
(22
|
)
|
|
General and administrative (3) | | |
|
(29
|
)
| | |
|
—
| | | |
|
(29
|
)
| | |
|
(25
|
)
|
| Adjusted EBITDA | | |
$
|
186
| | | |
$
|
(72
|
)
| | |
$
|
114
| | | |
$
|
101
| |
|
Adjusted EBITDA margin %
| | | |
29.0
|
%
| | | |
55.8
|
%
| | | |
22.2
|
%
| | | |
22.6
|
%
|
|
EBITDA margin %
| | | |
28.2
|
%
| | | |
54.3
|
%
| | | |
21.6
|
%
| | | |
21.3
|
%
|
|
_____________________
|
(1) |
|
For three months ended Dec. 31, 2018 and 2017, amounts include $2
million and $3 million, respectively, of costs associated with the
spin-off transaction.
|
(2) | |
Includes intersegment eliminations, share-based compensation
attributable to the segment and other adjustments.
|
(3) | |
Excludes share-based compensation and other adjustment items.
|
| |
|
|
|
| T-19 |
| HILTON GRAND VACATIONS INC. |
| NEW ACCOUNTING STANDARD ADOPTION – EFFECT ON THE YEAR ENDED
DECEMBER 31, 2018 |
| SEGMENT EBITDA AND ADJUSTED EBITDA TO NET INCOME |
| (in millions) |
|
|
|
|
| Year Ended December 31, 2018 | |
|
| | | |
| | | As Reported | |
|
| Effects of ASC 606 | |
|
| Previous Accounting Guidance | | | | Year Ended December 31, 2017 | |
| Net Income | | |
$
|
298
| | | |
$
|
(51
|
)
| | |
$
|
247
| | | |
$
|
327
| |
|
Interest expense
| | | |
30
| | | | |
—
| | | | |
30
| | | | |
27
| |
|
Income tax expense (benefit)
| | | |
105
| | | | |
(17
|
)
| | | |
88
| | | | |
(16
|
)
|
|
Depreciation and amortization
| | | |
36
| | | | |
2
| | | | |
38
| | | | |
29
| |
Interest expense, depreciation and amortization included in equity
in losses from unconsolidated affiliates
| | |
|
4
| | | |
|
—
| | | |
|
4
| | | |
|
3
| |
| EBITDA | | | |
473
| | | | |
(66
|
)
| | | |
407
| | | | |
370
| |
|
Other loss, net
| | | |
1
| | | | |
—
| | | | |
1
| | | | |
—
| |
|
Share-based compensation expense
| | | |
16
| | | | |
—
| | | | |
16
| | | | |
15
| |
|
Other adjustment items (1) | | |
|
13
| | | |
|
(2
|
)
| | |
|
11
| | | |
|
10
| |
| Adjusted EBITDA | | |
$
|
503
| | | |
$
|
(68
|
)
| | |
$
|
435
| | | |
$
|
395
| |
| | | | | | | | | | | | | | | | | | | |
|
| Adjusted EBITDA: | | | | | | | | | | | | | | | | | | | | |
|
Real estate sales and financing (2) | | |
$
|
447
| | | |
$
|
(68
|
)
| | |
$
|
379
| | | |
$
|
359
| |
|
Resort operations and club management (2) | | |
|
245
| | | |
|
—
| | | |
|
245
| | | |
|
204
| |
|
Segment Adjusted EBITDA
| | | |
692
| | | | |
(68
|
)
| | | |
624
| | | | |
563
| |
|
Adjustments:
| | | | | | | | | | | | | | | | | | | | |
|
Adjusted EBITDA from unconsolidated affiliates
| | | |
4
| | | | |
—
| | | | |
4
| | | | |
4
| |
|
License fee expense
| | | |
(98
|
)
| | | |
—
| | | | |
(98
|
)
| | | |
(87
|
)
|
|
General and administrative (3) | | |
|
(95
|
)
| | |
|
—
| | | |
|
(95
|
)
| | |
|
(85
|
)
|
| Adjusted EBITDA | | |
$
|
503
| | | |
$
|
(68
|
)
| | |
$
|
435
| | | |
$
|
395
| |
|
Adjusted EBITDA margin %
| | | |
25.2
|
%
| | | |
71.6
|
%
| | | |
22.8
|
%
| | | |
23.1
|
%
|
|
EBITDA margin %
| | | |
23.7
|
%
| | | |
69.5
|
%
| | | |
21.4
|
%
| | | |
21.6
|
%
|
|
_____________________
|
(1) |
|
For the years ended Dec. 31, 2018 and 2017, amounts include $11
million and $8 million, respectively, of costs associated with the
spin-off transaction.
|
(2) | |
Includes intersegment eliminations, share-based compensation
attributable to the segment and other adjustments.
|
(3) | |
Excludes share-based compensation and other adjustment items.
|
| |
|
|
|
| | |
|
| | | |
| T-20 |
| HILTON GRAND VACATIONS INC. |
| NEW ACCOUNTING STANDARD ADOPTION – EFFECT ON THE THREE MONTHS
ENDED DECEMBER 31, 2018 |
| REAL ESTATE MARGIN |
| (in millions) |
| | | | | | | | |
|
| | | Three Months Ended December 31, 2018 | | | | | | |
| | | As Reported | |
|
| Effect of ASC 606 | |
|
| Previous Accounting Guidance | | | | Three Months Ended December 31, 2017 | |
|
Sales of VOIs, net
| | |
$
|
307
| | | |
$
|
(142
|
)
| | |
$
|
165
| | | |
$
|
142
| |
|
Sales, marketing, brand and other fees
| | | |
147
| | | | |
12
| | | | |
159
| | | | |
143
| |
|
Less:
| | | | | | | | | | | | | | | | | | | | |
|
Marketing revenue and other fees
| | |
|
32
| | | |
|
7
| | | |
|
39
| | | |
|
36
| |
|
Sales revenue
| | | |
422
| | | | |
(137
|
)
| | | |
285
| | | | |
249
| |
|
Less:
| | | | | | | | | | | | | | | | | | | | |
|
Cost of VOI sales
| | | |
101
| | | | |
(46
|
)
| | | |
55
| | | | |
41
| |
|
Sales and marketing expense, net
| | |
|
162
| | | |
|
(20
|
)
| | |
|
142
| | | |
|
128
| |
| Real estate margin | | |
$
|
159
| | | |
$
|
(71
|
)
| | |
$
|
88
| | | |
$
|
80
| |
|
Real estate margin percentage
| | | |
37.7
|
%
| | | |
51.8
|
%
| | | |
30.9
|
%
| | | |
32.1
|
%
|
| | | | | | | | | | | | | | | | | | | |
|
|
|
| | |
|
| | | |
| T-21 |
| HILTON GRAND VACATIONS INC. |
| NEW ACCOUNTING STANDARD ADOPTION – EFFECT ON THE YEAR ENDED
DECEMBER 31, 2018 |
| REAL ESTATE MARGIN |
| (in millions) |
| | | | | | | | |
|
| | | Year Ended December 31, 2018 | | | | | | |
| | | As Reported | |
|
| Effect of ASC 606 | |
|
| Previous Accounting Guidance | | | | Year Ended December 31, 2017 | |
|
Sales of VOIs, net
| | |
$
|
734
| | | |
$
|
(112
|
)
| | |
$
|
622
| | | |
$
|
548
| |
|
Sales, marketing, brand and other fees
| | | |
570
| | | | |
16
| | | | |
586
| | | | |
544
| |
|
Less:
| | | | | | | | | | | | | | | | | | | | |
|
Marketing revenue and other fees
| | |
|
123
| | | |
|
16
| | | |
|
139
| | | |
|
145
| |
|
Sales revenue
| | | |
1,181
| | | | |
(112
|
)
| | | |
1,069
| | | | |
947
| |
|
Less:
| | | | | | | | | | | | | | | | | | | | |
|
Cost of VOI sales
| | | |
210
| | | | |
(30
|
)
| | | |
180
| | | | |
148
| |
|
Sales and marketing expense, net
| | |
|
575
| | | |
|
(15
|
)
| | |
|
560
| | | |
|
492
| |
| Real estate margin | | |
$
|
396
| | | |
$
|
(67
|
)
| | |
$
|
329
| | | |
$
|
307
| |
|
Real estate margin percentage
| | | |
33.5
|
%
| | | |
59.8
|
%
| | | |
30.8
|
%
| | | |
32.4
|
%
|
| | | | | | | | | | | | | | | | | | | |
|
|
|
| T-22 |
| HILTON GRAND VACATIONS INC. |
| FORWARD-YEAR ADJUSTED EBITDA RECONCILIATION |
| (in millions, except share data) |
|
|
|
|
| 2019(1) Low Case | |
|
| 2019(1) High Case | |
|
Contract Sales
| | | |
9.0
|
%
| | | |
11.0
|
%
|
|
Fee-for-service as % of contract sales
| | | |
48
|
%
| | | |
54
|
%
|
| | | | | | | | | |
|
|
Net Income
| | |
$
|
260
| | | |
$
|
275
| |
|
Income tax expense
| | |
|
97
| | | |
|
103
| |
|
Pre-tax income
| | | |
357
| | | | |
378
| |
|
Interest expense
| | | |
30
| | | | |
27
| |
|
Depreciation and amortization
| | | |
42
| | | | |
39
| |
Interest expense and depreciation and amortization included in
equity in earnings from unconsolidated affiliates
| | |
|
1
| | | |
|
2
| |
|
EBITDA
| | | |
430
| | | | |
446
| |
|
Share-based compensation expense
| | | |
18
| | | | |
20
| |
|
Other adjustment items
| | |
|
2
| | | |
|
4
| |
|
Adjusted EBITDA
| | |
$
|
450
| | | |
$
|
470
| |
| | | | | | | | | |
|
|
Diluted shares
| | |
95
| | | |
95
| |
|
Earnings per share - diluted
| | |
$
|
2.74
| | | |
$
|
2.89
| |
| | | | | | | | | |
|
|
Cash flow from operating activities
| | |
$
|
75
| | | |
$
|
115
| |
|
Non-inventory capex
| | |
|
(60
|
)
| | |
|
(50
|
)
|
|
Free Cash Flow
| | | |
15
| | | | |
65
| |
|
Net proceeds from securitization activity
| | |
|
45
| | | |
|
55
| |
|
Adjusted Free Cash Flow
| | |
$
|
60
| | | |
$
|
120
| |
| | | | | | | | | |
|
|
_____________________
|
(1) |
|
2019 Guidance assumes no full-year impact from construction-related
revenues or expenses deferrals.
|
| |
|

View source version on businesswire.com: https://www.businesswire.com/news/home/20190227005960/en/
Contacts:
Investor Contact:
Robert LaFleur
407-613-3327
Robert.Lafleur@hgv.com
Media Contact:
Lauren George
407-613-8431
Lauren.George@hgv.com
Source: Hilton Grand Vacations Inc.
© 2024 Canjex Publishing Ltd. All rights reserved.