Exceptional result includes a spectacular high-grade Mineral Resource of 8.8Mt @ 3.9% CuEq (346kt CuEq) in M&I and 10.9Mt @ 3.8% CuEq (414kt CuEq) in Inferred categories; This recently established high-grade core zone stands to deliver huge benefits to the Project’s development potential, particularly in the early years
KEY POINTS
Substantial Mineral Resource Increase and Upgrade:
- Green Bay Mineral Resource increases to 50.4Mt @ 2.0% copper equivalent (CuEq)1 in the Measured and Indicated (M&I) categories and 29.3Mt @ 2.5% CuEq in the Inferred Mineral Resource category (Inferred)
- The total contained metal and total tonnes have increased significantly
- Contained copper increases to 863kt M&I (+113%) plus 566kt Inferred
- Contained gold increases to 546koz M&I (+174%) plus 563koz Inferred (+62%)
- A newly established high-grade core zone of the Mineral Resource includes 8.8Mt @ 3.9% CuEq in the M&I and 10.9Mt @ 3.8% CuEq in the Inferred Resource categories
- Importantly, the highly valuable M&I categories of Mineral Resource at the Ming Deposit have grown by 121% (from 21.5Mt to 47.5Mt) and now make up 67% of the Ming Deposit Mineral Resource. This is significant as the M&I Resources will underpin economic studies
The Outlook – Mineral Resource growth and upgrades, eight rigs, economic studies, offtake discussions, regional discoveries:
- The mineralisation remains completely open, including in the high-grade core zone, where the furthest step-out hole ever drilled on the edge of this Mineral Resource graded 49m @ 6.1% CuEq (including 14.3m @ 13.7% CuEq) (see ASX announcement dated 16 October 2025)
- Scope for further growth is also shown by the large high-tenor Down Hole Electro-Magnetic (DHEM) conductor extending well beyond the boundary of the Mineral Resource
- Drilling is underway to convert more Inferred Mineral Resources (29.3Mt @ 2.5% CuEq) to M&I for the economic studies; A large portion of the high-grade core comprises Inferred Mineral Resources, including drill hole MUG25-202 which returned 49.0m @ 6.1% CuEq, highlighting the strong scope for M&I growth
- Given the potentially significant impact on the economic studies of the large amount of recently discovered high-grade mineralisation, particularly in the early years, FireFly intends to release the study results in the first half of 2026
- Six rigs will continue drilling underground into 2026 while surface drill rigs will test the abundant targets generated by recent geophysics and field activities
- Discussions with potential offtake customers, export credit agencies and other commercial entities regarding funding options are underway; Initial talks reveal a strong appetite for the Company’s Green Bay concentrate, with several confidentiality agreements already signed
- FireFly had A$129.7M in cash, receivables and liquid investments at 30 September 2025
FireFly Managing Director Steve Parsons said: “This outstanding result cements Green Bay’s status as one of the most compelling copper development projects in the world.
“In just 12 months, we have grown the total Mineral Resource significantly. At the same time, we have established a high-grade core which stands to deliver huge benefits to the Project’s development potential, particularly in the initial years of production.
“We will maintain our relentless push to create shareholder value, with eight rigs on the job, to upgrade more of Inferred Mineral Resources to Measured and Indicated and to make new regional discoveries.
“And the appetite for our product is clearly very strong, with several parties signing confidentiality agreements and talks on offtake and funding progressing well.”
PERTH, Australia, Nov. 18, 2025 (GLOBE NEWSWIRE) -- FireFly Metals Ltd (ASX, TSX: FFM) (Company or FireFly) is pleased to announce a substantial Mineral Resource increase comprising strong growth in tonnes, grade and contained metal at its Green Bay Copper-Gold Project in Newfoundland, Canada.
The Mineral Resource Estimate (MRE) as updated in this announcement (November 2025 MRE) now stands at 50.4Mt @ 2.0% for 1Mt CuEq in the higher confidence Measured and Indicated (M&I) classifications plus an additional 29.3Mt @ 2.5% for 722kt CuEq in the Inferred category (Table 1). This represents a 35% increase in tonnes and a 51% increase in CuEq metal from the Mineral Resource Estimate announced by the Company on 29 October 2024 (October 2024 MRE).
Importantly, the MRE contains a zone of higher-grade material comprised of volcanogenic massive sulphide (VMS) mineralisation plus the recently discovered ‘core zone’ which totals 8.8Mt @ 3.9% CuEq in M&I and a further 10.9Mt @ 3.8% CuEq in the Inferred category.
Copper remains the dominant metal in the MRE (863kt M&I plus 566kt Inferred Resources) with gold forming an important by-product (546koz M&I plus 563koz Inferred Resources). Silver is also present in significant quantities in the latest MRE (5.0Moz M&I plus 4.8Moz Inferred Resources).
The total discovery cost per estimated tonne of CuEq metal added in this MRE is exceptionally low at C$25.122 (US$17.83) per tonne.
The Ming Deposit has been sampled exclusively by diamond drilling. A total of 1,334 diamond holes for a total drilled meterage of 319,534m was used to estimate the November 2025 MRE.
The Mineral Resource consists of two components, namely the Ming Deposit (47.5Mt @ 2.0% CuEq M&I plus 23.1Mt @ 2.6% CuEq Inferred) and the Little Deer deposit (2.9Mt @ 2.3% CuEq M&I plus 6.2Mt @ 1.8% CuEq Inferred). All growth has come from the Ming Deposit with the Little Deer MRE remaining unchanged since the October 2024 MRE.
| | TONNES | COPPER | GOLD | SILVER | CuEq |
| | (Mt) | Grade | Metal | Grade | Metal | Grade | Metal | Grade |
| | | (%) | (‘000 t) | (g/t) | (‘000 oz) | (g/t) | (‘000 oz) | (%) |
| Measured | 6.3 | 1.5 | 94 | 0.3 | 50 | 1.9 | 388 | 1.7 |
| Indicated | 44.1 | 1.7 | 769 | 0.4 | 496 | 3.3 | 4,638 | 2.1 |
| TOTAL M&I | 50.4 | 1.7 | 863 | 0.3 | 546 | 3.1 | 5,026 | 2.0 |
| Inferred | 29.3 | 1.9 | 566 | 0.6 | 563 | 5.1 | 4,810 | 2.5 |
Table 1: Mineral Resource Estimate for the Green Bay Copper-Gold Project as at 10 November 2025. The Mineral Resource is reported at a 1% copper cut-off. Gold-rich 1806 and 1807 VMS domains have been reported at a 1% CuEq cut-off. The same cut-off grade and metal equivalent parameters have been applied to the November 2025 MRE as the superseded October 2024 MRE to allow like-for-like comparisons. Refer to following sections of this announcement and Appendix B ‘JORC Table 1’ for further details on the MRE.
Both the Ming Deposit and Little Deer estimates have been prepared in accordance with the 2012 Edition of the Australasian Code for Reporting of Exploration Results, Mineral Resources and Ore Reserves (JORC Code 2012) and Canadian National Instrument 43-101 - Standards of Disclosure for Mineral Projects (NI 43-101). The MRE was completed by external independent consulting groups.
The November 2025 MRE saw significant increases across key categories (Figures 1 and 2). The increase in the Mineral Resource has been driven primarily by the successful growth strategy implemented by FireFly since it acquired Green Bay in October 2023. Over 2,300m of underground development has been mined at Green Bay’s Ming Deposit to position the drill rigs to effectively test down-plunge extensions of the high-grade VMS mineralisation and broad footwall copper stringer zone (FWZ).
Up to six underground rigs have been operating since the October 2024 MRE was completed and an additional 78,165m of drilling has been used to prepare this latest MRE (Figure 3).
The Company’s focus on upgrading areas of lesser drill spacing into higher confidence Mineral Resources is reflected by the 107% increase in the tonnes of M&I material. The M&I portion of the MRE increased from 24.4Mt in the October 2024 MRE to 50.4Mt in this MRE. Importantly, the M&I grade also increased despite the substantial increase in tonnes and now sits at 2.02% CuEq (+7%). M&I Mineral Resources now constitute 63% of the total MRE, which is significant because only the higher confidence M&I Mineral Resources can be used in future feasibility studies.
Overall, Inferred Mineral Resources decreased by 15%. This was primarily due to the successful conversion of 26Mt of Inferred material into the M&I category by infill drilling. The conversion was partially offset by the discovery of extensive down-plunge extensions of the Ming mineralisation up to 700m beyond the extent of the October 2024 MRE. The furthest step out hole into the mineralisation returned 49.0m @ 6.1% CuEq and remains open (see ASX announcement dated 16 October 2025). This intersection forms the limit of the November 2025 MRE.
The grade of copper and precious metals has significantly increased in the Inferred MRE due primarily to increasing grade at depth from the recent drilling. Drilling from the higher-grade core zone (see ASX announcement dated 27 October 2025) where the VMS and FWZ converge has been incorporated into this estimate in the Inferred category. Significant intersections from this zone include 86.3m @ 3.7% CuEq, 43.6m @ 7.6% CuEq and 44.5m @ 3.7% CuEq (see ASX announcement dated 27 October 2025). The Inferred MRE grade stands at 2.5% CuEq up from 2.0% CuEq in the October 2024 MRE. The grade of gold has almost doubled and now stands at 0.6g/t due to the addition of the higher-grade VMS material.
Furthermore, the addition of more VMS material in the latest MRE has seen contained gold in the MRE increase by 103% to now exceed 1.1Moz (546koz in M&I plus 563koz in Inferred). Silver has also increased significantly by 84% to total 9.8Moz (5.0Moz in M&I plus 4.8Moz in Inferred).
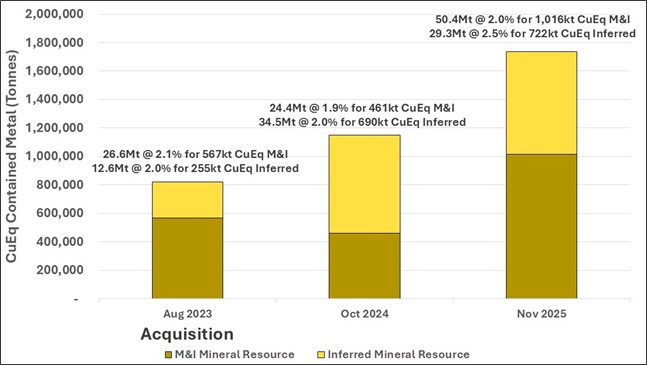
Figure 1: Year-on-Year increase in Mineral Resource contained copper equivalent metal since acquisition of the Green Bay Copper-Gold Project in 2023. Please refer to compliance statements for metal equivalent details.
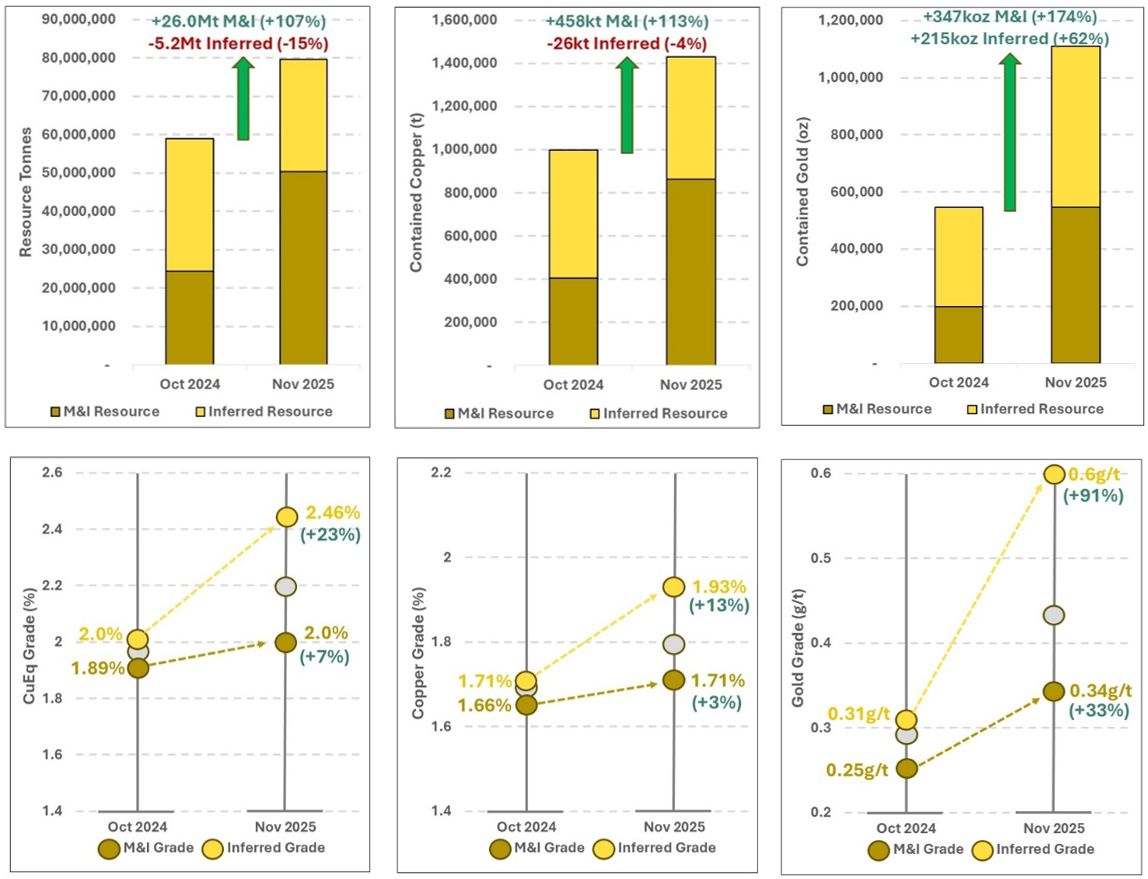
Figure 2: Year on Year changes between the October 2024 MRE and November 2025 MRE for Tonnes, Grade and Contained Metal. This latest estimate has seen significant year-on-year increases in tonnes, grades and metal content.
With latest gold metallurgical testwork indicating recoveries of 85% (see ASX announcement dated 5 August 2025), gold will provide substantial by-product revenue in any potential future mining operation.
This November 2025 MRE is reported using a 1% copper cut-off grade, the same as the previous October 2024 MRE. Sensitivity analysis demonstrates that the potential scale of the Project increases significantly as the cut-off grade is lowered (Table 2). At a 0.6% copper cut-off, the estimate increases to 79.1Mt @ 1.7% for 1.2Mt CuEq in M&I plus 38.7Mt @ 2.1% for 804kt CuEq in Inferred. Both bulk and selective mining options will be contemplated as part of future economic evaluations.
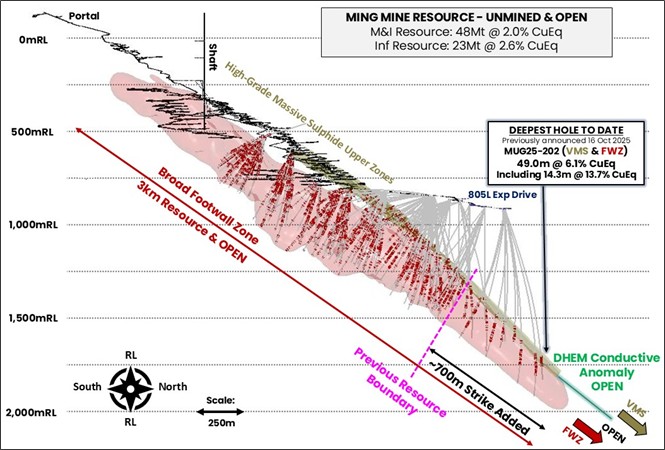
Figure 3: Long section of the Ming Deposit MRE extent and new drilling completed since the previous October 2024 MRE.The MRE remains open and geophysical DHEM conductors indicate the mineralisation likely continues down plunge. Red wireframe is the FWZ mineralisation envelope and gold wireframes are the upper high-grade copper-gold VMS zones. Red on drillholes are assays >0.5% copper.
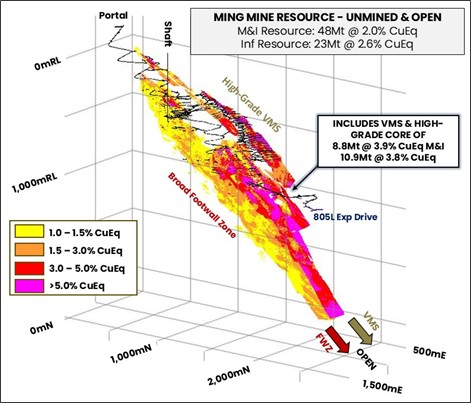
Figure 4: Isometric view of the Ming Mineral Resource Model. All blocks above 1% CuEq shown. The Mineral Resource consists of a very high-grade VMS zone and core of 8.8Mt @ 3.9% CuEq M&I and 10.9Mt @ 3.8% CuEq Inferred. This is underlain by the broad FWZ stringer mineralisation.
| GREEN BAY MEASURED & INDICATED MINERAL RESOURCE - COG SENSITIVITY |
CUT-OFF GRADE (Cu %)
| TONNES
(Mt)
| GRADE | METAL | CuEq |
Cu
(%) | Au
(g/t) | Ag
(g/t) | Cu
(Kt) | Au
(koz) | Ag
(koz) | Grade (%) | Metal (kt) |
| 0.6 | 72.0 | 1.4 | 0.3 | 2.5 | 1,034 | 627 | 5,833 | 1.68 | 1,209 |
| 0.8 | 61.3 | 1.6 | 0.3 | 2.8 | 961 | 591 | 5,483 | 1.84 | 1,126 |
| 1.0 | 50.4 | 1.7 | 0.3 | 3.1 | 863 | 546 | 5,024 | 2.02 | 1,016 |
| GREEN BAY INFERRED MINERAL RESOURCE - COG SENSITIVITY |
CUT-OFF GRADE (Cu %)
| TONNES
(Mt)
| GRADE | METAL | CuEq |
Cu
(%) | Au
(g/t) | Ag
(g/t) | Cu
(Kt) | Au
(koz) | Ag
(koz) | Grade (%) | Metal (kt) |
| 0.6 | 38.7 | 1.7 | 0.5 | 4.2 | 639 | 594 | 5,226 | 2.1 | 804 |
| 0.8 | 33.1 | 1.8 | 0.5 | 4.7 | 601 | 577 | 4,999 | 2.3 | 761 |
| 1.0 | 29.3 | 1.9 | 0.6 | 5.1 | 566 | 563 | 4,810 | 2.5 | 722 |
Table 2: November 2025 MRE sensitivity to the reporting cut-off grade by Mineral Resource categories. The November 2025 MRE was reported at a 1.0% copper cut-off grade (highlighted).
Forward Work Plans
Near-term drilling activities at the Green Bay Copper-Gold Project will continue to focus on three key areas: Upgrading the Mineral Resource (with infill drilling results), Mineral Resource Growth, and NewDiscoveries from both underground and surface. Six underground rigs will continue to advance the underground Mineral Resource growth for the foreseeable future and into 2026.
Green Bay - Ming Deposit Mineral Resource
The MRE update in this announcement is the result of the low-cost Mineral Resource growth strategy underpinned by drilling from the 805L exploration drive at the Ming Mine. Further mining of additional drill platforms is underway with the aim of delivering additional Mineral Resources in 2026.
Drilling from underground will prioritise conversion of the higher grade 29Mt of Inferred Mineral Resources into the higher confidence M&I category in preparation for the Feasibility Study expected to be completed in the second half of 2026 (Figure 5). In a Feasibility Study, only the higher confidence Measured and Indicated Mineral Resources can be used in developing the mine economics and therefore maximising M&I is critical to demonstrate the true scale and economic potential of the deposit.
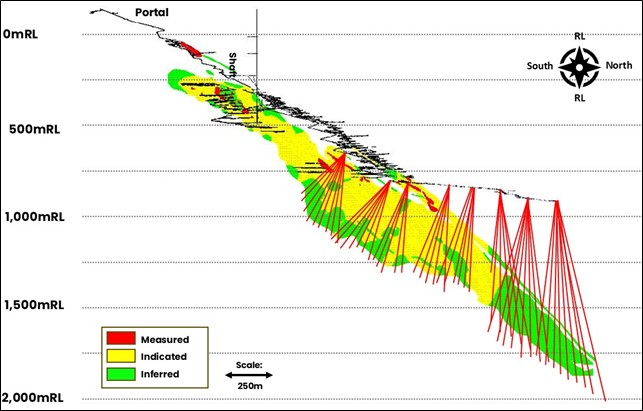
Figure 5: 2025-2026 drilling plan showing continued conversion of Inferred Mineral Resources (green) into the higher confidence Measured and Indicated Mineral Resources (yellow) ready for economic studies in 2026.
Green Bay (Ming Mine) Upscaled Project Development
Work on the development of the upscaled resumption of mining at the Ming Mine is well underway. The MRE in this announcement will underpin the first Preliminary Economic Assessment (PEA) study planned for completion in the first half of 2026.
Detailed mine design, scheduling and economic analysis based on the updated MRE in this announcement by both external consultants and the FireFly engineering team will now commence.
Ausenco continue to complete detailed engineering design work on the potential future processing facility. Further metallurgical testwork is underway to assess options to further optimise recovery of by-product precious metals from the Ming Deposit. This work has the potential to add significantly to the economics of the future mine, with the latest MRE containing 1.1Moz of gold and 9.8Moz of silver.
Design work has commenced in conjunction with local company Shoreline Aggregates Inc. to jointly develop an additional berth suitable for the export of copper concentrate from the nearby Pine Cove port (only 5km away). This work will continue into the new year, and the costings will be included in the PEA.
Company representatives and Directors have met with numerous offtake groups, sovereign credit export agencies and other commercial entities to discuss potential future funding pathways as the Project rapidly progresses towards feasibility. The appetite for the concentrate from the Ming Mine appears strong with numerous confidentiality agreements being signed with these counterparties. The financing strategy will be ongoing as the various scenarios for an upscaled restart to operations are being evaluated. With the significant increase in this latest MRE, the Company wishes to avoid unnecessarily limiting the size of any future potential upscaled mining operation until it has completed further economic assessment.
Following the recent conditional release from further Environmental Assessment by the Province of Newfoundland and Labrador for a start-up mining and processing operation (see ASX announcement dated 5 August 2025), the Company continues to apply for permits to commence early works and construction. The Company intends to commence selective low-cost seasonal early works in the coming months to prepare the Project for future development and construction.
Green Bay (Ming Mine) Regional Discovery
Regional explorationis underway with two surface drill rigs testing high-priority targets across the Company’s 346km2 surface exploration claims.
One of the drill rigs will continue to test high-priority targets close to the Ming Mine. The second drill rig will systematically test early-stage greenfields targets generated by airborne VTEM and magnetic surveys completed in 2024 and 2025.
FireFly has continued to invest in regional-scale geophysics as a key exploration tool. The Company is completing a detailed VTEM survey over the 115km2 Tilt Cove Project. A detailed helicopter magnetic survey is also being completed over the central Green Bay leases.
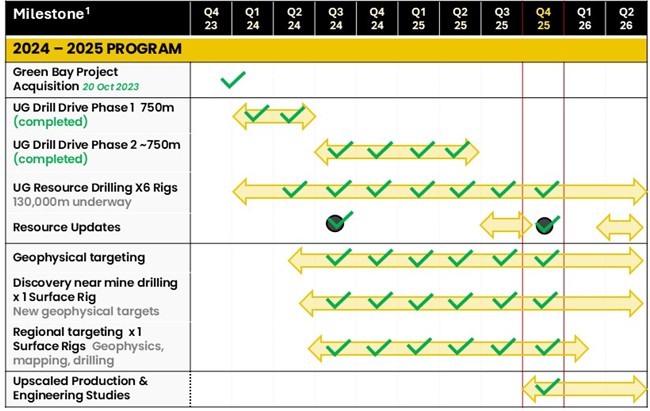
Figure 6: Key 2024-2025 milestones for the Green Bay Copper-Gold Project.
- Timelines are indicative and may be subject to change.
Funding and Corporate Activities
The Company remains well funded to complete its accelerated exploration growth strategy and economic studies as the Project further advances toward rapid low-cost development. Cash, receivables and liquid investments total A$129.7M at 30 September 2025 (see ASX announcement dated 30 October 2025).
Steve Parsons
Managing Director
FireFly Metals Ltd
+61 8 9220 9030 | Jessie Liu-Ernsting
Chief Development Officer
FireFly Metals Ltd
+1 709 800 1929 | Media
Paul Armstrong
Read Corporate
+61 8 9388 1474 |
| | | |
About the Mineral Resource Estimate
Green Bay Copper-Gold Project location
The Company’s Green Bay Copper-Gold Project is located in the northern coastal region of central Newfoundland, Canada (Figure 7). FireFly holds ~346km2 of prime mineral claims in the heart of the prolific Baie Verte mineral district, which hosts numerous base metal volcanogenic massive sulphide (VMS) and orogenic gold deposits.
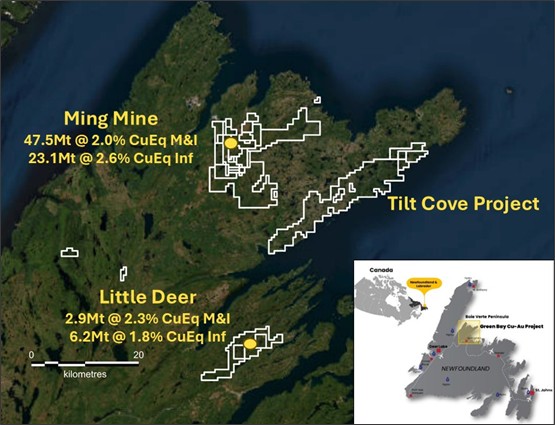
Figure 7: (Left) Location of the Green Bay copper-gold project in Newfoundland, Canada; (Right) FireFly’s mineral claims and simplified geology of the Baire Verte mineral district.
Green Bay Mineral Resource Estimate
The Green Bay Mineral Resource consists of the Ming Deposit and Little Deer. The Green Bay Mineral Resource Estimate by source is shown in Table 3.
The Ming and Little Deer Mineral Resource Estimates have been prepared in accordance with the JORC Code (2012 Edition) and Canadian National Instrument 43-101 by independent external consultants.
The growth in the global Mineral Resource Estimate has come exclusively from the Ming Deposit which has been the focus of drilling and underground development activities over the past year. No additional information was collected from the Little Deer deposit.
Ming Deposit Mineral Resource Estimate
| | TONNES | COPPER | GOLD | SILVER | CuEq |
| | (Mt) | Grade | Metal | Grade | Metal | Grade | Metal | Grade |
| | | (%) | (‘000 t) | (g/t) | (‘000 oz) | (g/t) | (‘000 oz) | (%) |
| Measured | 6.3 | 1.5 | 94 | 0.3 | 50 | 1.9 | 388 | 1.7 |
| Indicated | 41.2 | 1.7 | 708 | 0.4 | 488 | 3.2 | 4,320 | 2.1 |
| TOTAL M&I | 47.5 | 1.7 | 802 | 0.4 | 537 | 3.1 | 4,708 | 2.0 |
| Inferred | 23.1 | 2.0 | 456 | 0.7 | 553 | 5.9 | 4,379 | 2.6 |
Little Deer Mineral Resource Estimate
| | TONNES | COPPER | GOLD | SILVER | CuEq |
| | (Mt) | Grade | Metal | Grade | Metal | Grade | Metal | Grade |
| | | (%) | (‘000 t) | (g/t) | (‘000 oz) | (g/t) | (‘000 oz) | (%) |
| Measured | - | - | - | - | - | - | - | - |
| Indicated | 2.9 | 2.1 | 62 | 0.1 | 9 | 3.4 | 320 | 2.3 |
| TOTAL M&I | 2.9 | 2.1 | 62 | 0.1 | 9 | 3.4 | 320 | 2.3 |
| Inferred | 6.2 | 1.8 | 110 | 0.1 | 10 | 2.2 | 430 | 1.8 |
TOTAL GREEN BAY MINERAL RESOURCE ESTIMATE
| | TONNES | COPPER | GOLD | SILVER | CuEq |
| | (Mt) | Grade | Metal | Grade | Metal | Grade | Metal | Grade |
| | | (%) | (‘000 t) | (g/t) | (‘000 oz) | (g/t) | (‘000 oz) | (%) |
| Measured | 6.3 | 1.5 | 94 | 0.3 | 50 | 1.9 | 388 | 1.7 |
| Indicated | 44.1 | 1.7 | 769 | 0.4 | 496 | 3.3 | 4,638 | 2.1 |
| TOTAL M&I | 50.4 | 1.7 | 863 | 0.3 | 546 | 3.1 | 5,026 | 2.0 |
| Inferred | 29.3 | 1.9 | 566 | 0.6 | 563 | 5.1 | 4,810 | 2.5 |
Table 3: November 2025 Mineral Resource Estimate for the Green Bay Copper-Gold Project
Variance to the previous Mineral Resource Estimate
The variance between the previous Mineral Resource Estimate (October 2024 MRE) and the current estimate (November 2025 MRE) is summarised in Table 4. Both estimates were reported at a 1% copper cut-off grade. Commodity prices used in the copper equivalent calculations were also the same to enable like-for-like comparison.
The November 2025 MRE shows a significant increase in overall tonnes and metal with grade increasing across all Mineral Resource categories. The Little Deer estimate has not changed because no additional data was added during 2023 and 2024.
| | MEASURED & INDICATED | INFERRED |
| | Tonnes | Grade | Metal | Tonnes | Grade | Metal |
| Copper | +26.0Mt
(+107%)
| +0.09%
(+3%) | +458kt
(+113%) | -5.2Mt
(-15%)
| +0.22%
(+13%) | -26kt
(-4%) |
| Gold | +0.08g/t
(+33%) | +347koz
(+174%) | +0.28g/t
(+91%) | +215koz
(+62%) |
| Silver | +0.61g/t
(+24%) | +3.1Moz
(+157%) | +2.05g/t
(+67%) | +1.4Moz
(+42%) |
| CuEq | +0.13%
(+7%) | +555kt
(+120%) | +0.6%
(+23%) | +32kt
(+5%) |
Table 4: Variance of tonnes, grade and contained metal between the October 2024 MRE and the November 2025 MRE. Note that both Mineral Resource Estimates were reported at a 1% copper cut-off grade, and the gold-rich 1806 and 1807 VMS domains were reported at a 1% CuEq cut-off. Copper equivalent calculations used the same commodity prices and recovery factors to enable like-for-like comparisons. Please refer to ASX announcement dated 29 October 2024 for details of the October 2024 MRE.
Key reasons for the change in the Mineral Resource Estimate at Ming include, but are not limited to:
- Additional data: 242 new holes for 78,165m of diamond drilling completed underground at Ming;
- Significant investment in infill drilling resulting in the addition of 26Mt (+107%) of material in the M&I Mineral Resource categories;
- Despite the 107% increase in M&I, Inferred Mineral Resources only decreased by 15% due to the discovery extensions of both VMS and FWZ mineralisation for 700m beyond the October 2024 MRE;
- Copper, Gold and Silver grades increased across all Mineral Resource categories due to extensions of the high-grade Cu-Au-Ag VMS zones and discovery of the core zone where the VMS and FWZ mineralisation converge;
- Gold content increased significantly (+347koz M&I plus +215koz Inferred) driven by higher grades and gold-dominant zones discovered in the VMS lenses; and
- Improved geological and structural models, with particular focus on improving interpretation and treatment of post-mineral dykes.
Sensitivity Analysis of the MRE
The Green Bay Mineral Resource Estimate is sensitive to the lower cut-off grade applied. This will be considered in future mining studies, with unit costs heavily influenced by the selected mining method and eventual processing capacity.
The grade-tonnage sensitivity analysis is presented in Figure 8. Contained metal content sensitivity to cut-off grade for CuEq, copper and gold are shown in Figures 9, 10 and 11.
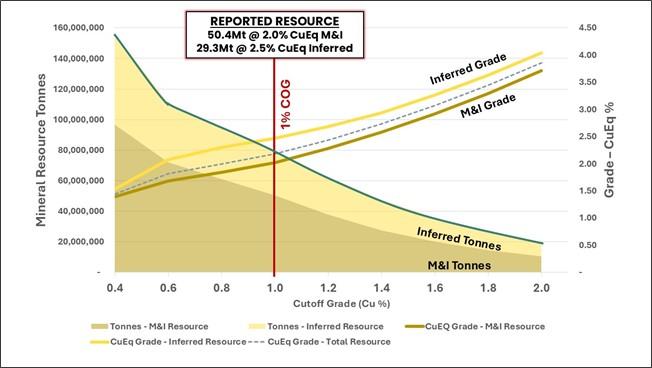
Figure 8: Green Bay Mineral Resource Grade-Tonnage sensitivity analysis by Mineral Resource category at various copper cut-off grades. Please refer to compliance statement in this announcement for parameters used to calculate the copper equivalent grade.
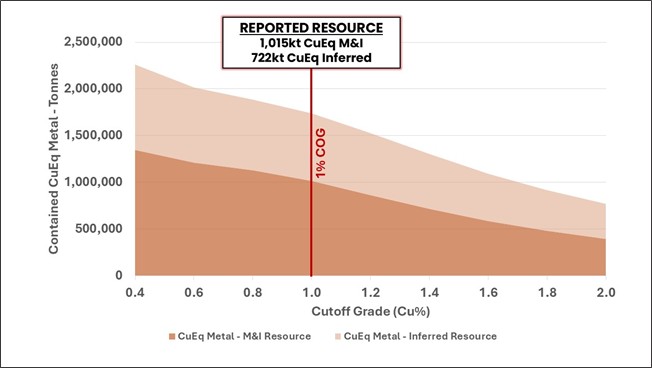
Figure 9: Green Bay Mineral Resource Estimate contained Copper equivalent metal sensitivity to the cut-off grade by Mineral Resource category.
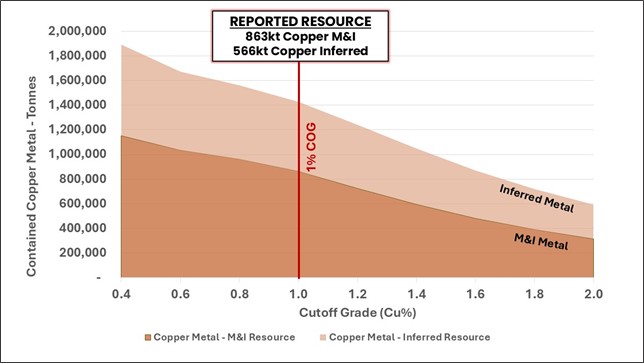
Figure 10: Green Bay Mineral Resource contained copper sensitivity to the cut-off grade by Mineral Resource category.
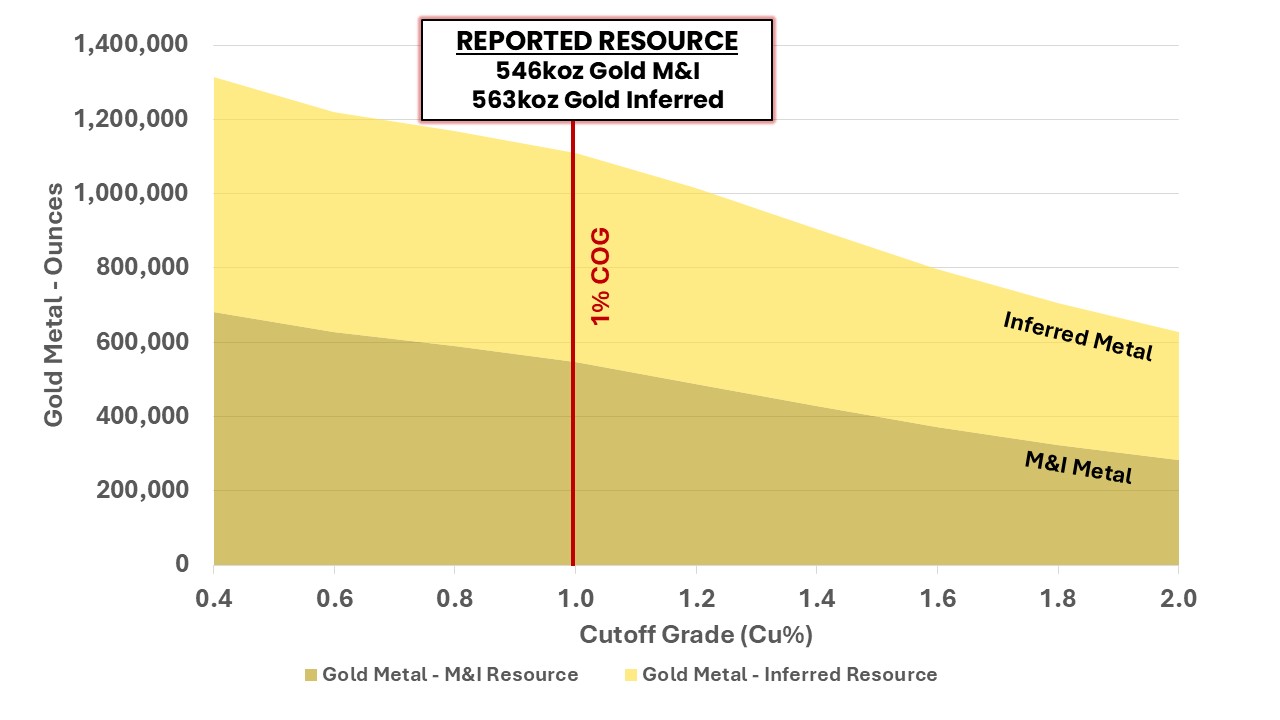
Figure 11: Green Bay Mineral Resource contained gold sensitivity to cut-off grade by Mineral Resource category.
Ming Deposit Mineral Resource Estimate
The Ming Deposit November 2025 MRE (Table 5) was prepared in accordance with the JORC Code (2012 Edition) and Canadian National Instrument 43-101 by independent consultants, Cube Consulting Pty Ltd.
| | TONNES | COPPER | GOLD | SILVER | CuEq |
| | (Mt) | Grade | Metal | Grade | Metal | Grade | Metal | Grade |
| | | (%) | (‘000 t) | (g/t) | (‘000 oz) | (g/t) | (‘000 oz) | (%) |
| Measured | 6.3 | 1.5 | 94 | 0.3 | 50 | 1.9 | 388 | 1.7 |
| Indicated | 41.2 | 1.7 | 708 | 0.4 | 488 | 3.2 | 4,320 | 2.1 |
| TOTAL M&I | 47.5 | 1.7 | 802 | 0.4 | 537 | 3.1 | 4,708 | 2.0 |
| Inferred | 23.1 | 2.0 | 456 | 0.7 | 553 | 5.9 | 4,379 | 2.6 |
Table 5: November 2025 Mineral Resource Estimate for the Ming Deposit
Additional data informing the updated Ming Deposit Mineral Resource Estimate
Drilling at the Ming underground copper-gold mine recommenced following the acquisition of the Green Bay Copper-Gold Project by FireFly in October 2023. The November 2025 MRE contains 242 new holes that contain an additional 78,165m of new data (Figure 12).
All results drilled by FireFly and used in the MRE have been previously reported in the Company’s ASX announcements.
Most of the drilling was completed from the exploration drill drive mined by FireFly, with over 2,300m of underground development completed by the owner-operator mining team since November 2023. Drill platforms were specifically designed to position drill rigs at favourable orientations sub-perpendicular to mineralisation.
Mine Geology and Geological Interpretation
The Ming Deposit is classified geologically as a volcanogenic massive sulphide (VMS) mineralised system. The Ming mineralisation is typically located at the regional contact between Cambrian-Ordovician aged felsic volcanics (rhyolite) and mafic volcanics.
Hydrothermal fluids migrated towards the surface via deep-tapping growth faults, driven by the heat generated from the tectonic collision and subduction of ancestral North America (Laurentia) beneath proto-Europe (Gondwana). The conceptual deposit model proposed by Pilote et al. (2016) is presented in Figure 13.
Mineralisation is locally intersected by post-mineral mafic gabbro dykes which can contain structurally controlled quartz-carbonate veins with remobilised sulphides.
Figure 14 shows a schematic cross-section of the Ming Deposit.
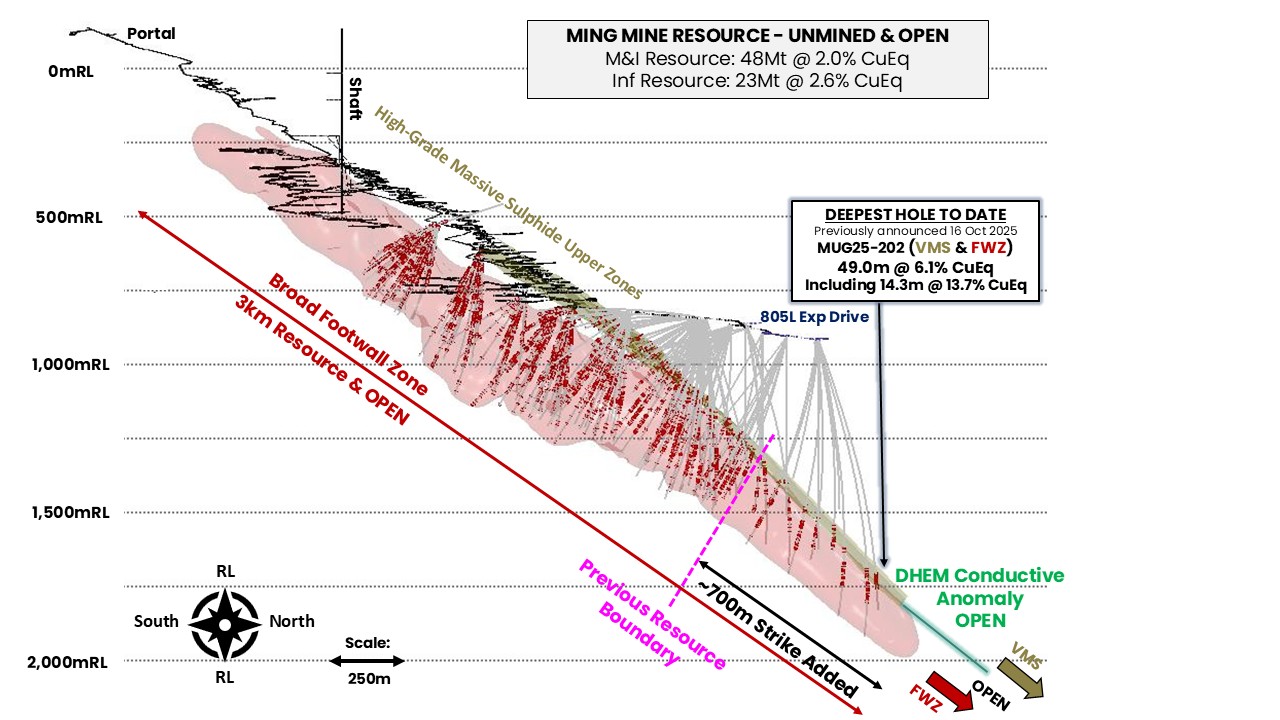
Figure 12: Long section of the Ming Deposit MRE extent and new drilling completed since the previous October 2024 MRE. The MRE remains open and geophysical DHEM conductors indicate the mineralisation likely continues down plunge. Red wireframe is the FWZ mineralisation envelope and gold wireframes are the upper high-grade copper-gold VMS zones. Red on drillholes are assays >0.5% copper.
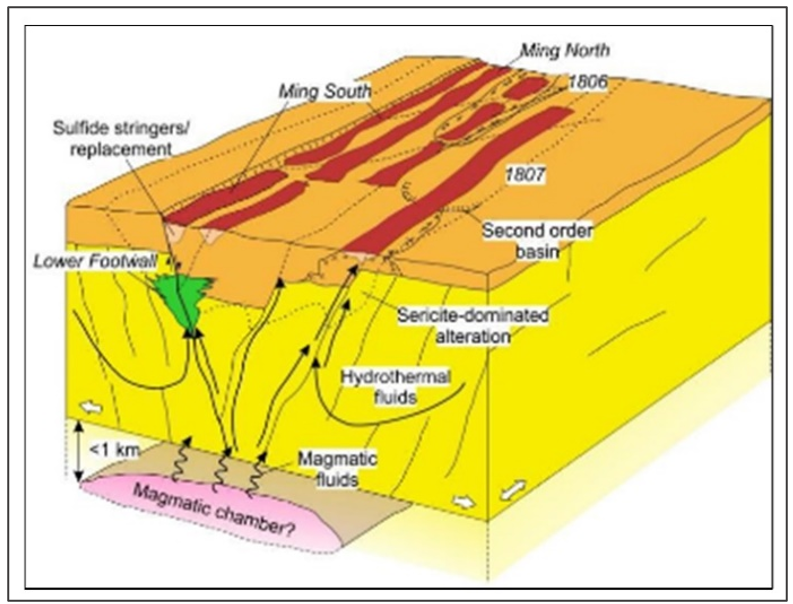
Figure 13: Ming mineralisation model proposed by Pilote et al (2016).
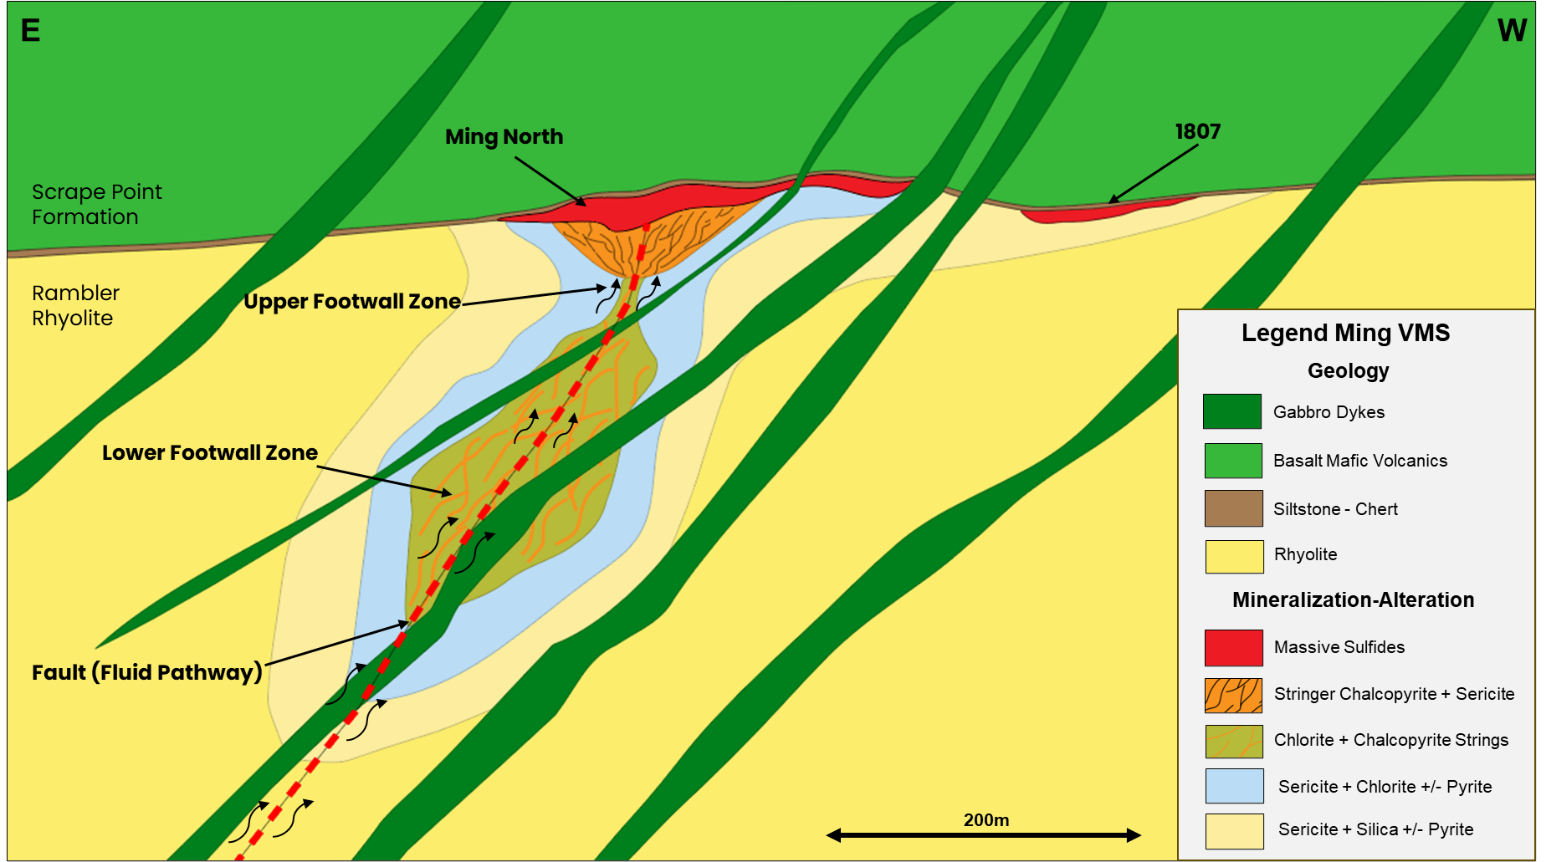
Figure 14: Conceptual cross section of the Ming Deposit showing the upper high-grade copper and gold rich VMS mineralised lenses and the sub-seafloor higher-temperature footwall zone stringer style mineralisation.
There are two distinct styles of mineralisation at the Ming Deposit:
- Polymetallic Volcanogenic Massive Sulphides (VMS): Polymetallic Cu-Au-Ag dominated massive sulphide lenses formed on the sea floor via the accumulation of precipitated sulphides around subaqueous volcanic vents. The sulphides are dominantly pyrite and chalcopyrite with lesser sphalerite (Figure 15). The channel-like geometry results in lenses that are between 3m and 15m in true thickness and widths of 100m laterally. The strike of these lenses at Ming now exceeds 2km and remains open.
- Broad Footwall Stringer-Style Mineralisation (FWZ): centimetre-scale veins of pyrite and chalcopyrite (Figure 16) interpreted to have formed as part of the hydrothermal feeder system below the sea floor. The sulphide stringers have been locally deformed and characteristically follow the foliation. The host rock is typically rhyolite that is intensely chlorite-altered reflecting the temperature and fluid pressure at formation. The zone of stringer mineralisation can be up to 300m wide, 200m in height, with grades locally reaching beyond 2% copper.
Recent drilling has shown that both styles of mineralisation converge in the lower extents of the Ming Deposit. The VMS and FWZ mineralisation forms a thick continuous pipe-like shoot that contains extensive grade over a known strike of 800m to date. The furthest hole into the deposit intersected the core zone and graded 49.0m @ 6.1% CuEq (Figures 17,18).
A cross section through the block model is presented in Figure 19.
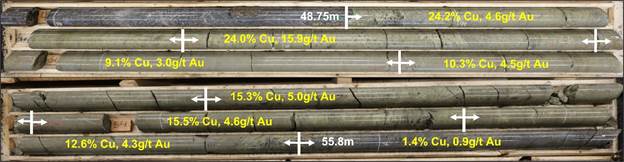
Figure 15: Massive sulphide copper-gold rich mineralisation intersected in FireFly resource extension drilling (MUG24-030). The core photograph shown (48.75m to 55.8m) is part of a broader reported intersection of 13.1m @ 14.3% CuEq (10.7% Cu & 4.1g/t Au) true thickness. The mineralisation is predominantly pyrite and chalcopyrite with lesser local sphalerite. Refer to FireFly’s ASX announcement dated 19 June 2024.
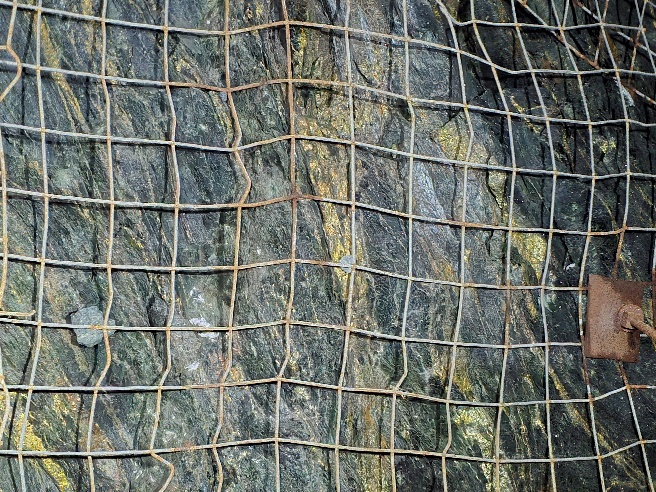
Figure 16: Stringer-style FWZ mineralisation from the 735 Level in the Ming Mine (photograph taken in September 2024). The mineralisation consists of individual mm to cm scale chalcopyrite-pyrite veins hosted within highly chloritised rhyolite. This mineralisation is amenable to large-scale mining and often bulks out to grades exceeding 2% copper.
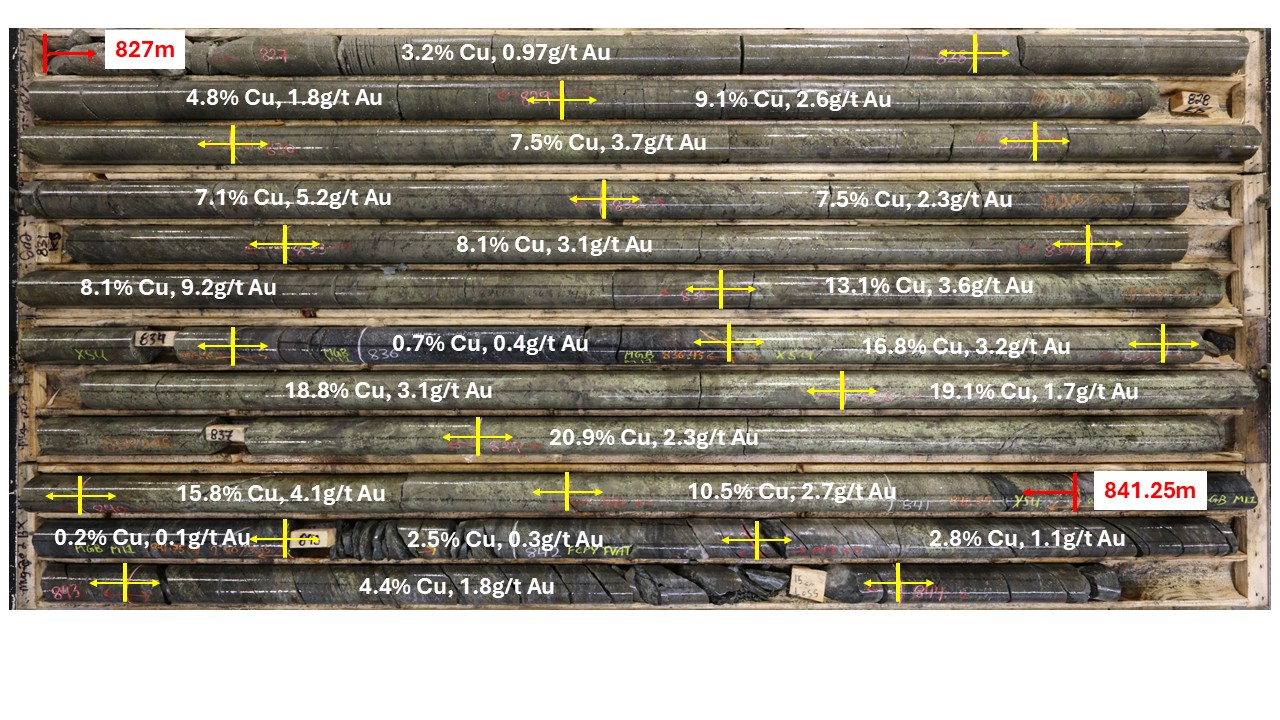
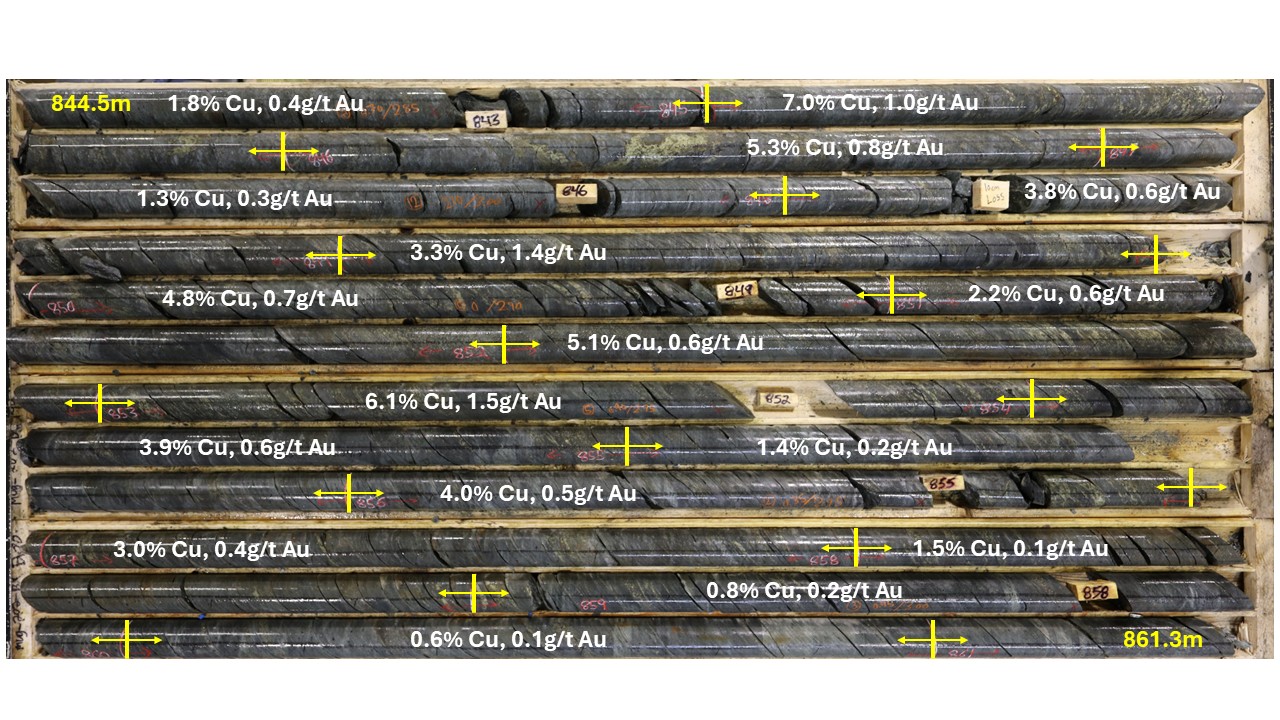
Figure 17: Core photographs for MUG25-202 showing the new very high grade core zone. This convergent zone consists of the upper VMS zone (827m-841.25m) that grades 14.3m @ 13.7% CuEq and the adjacent broad FWZ stringer-style mineralisation. This is part of the broader step-out intersection of 49.0m @ 6.1% CuEq that is the deepest hole drilled into the Ming Deposit to date.
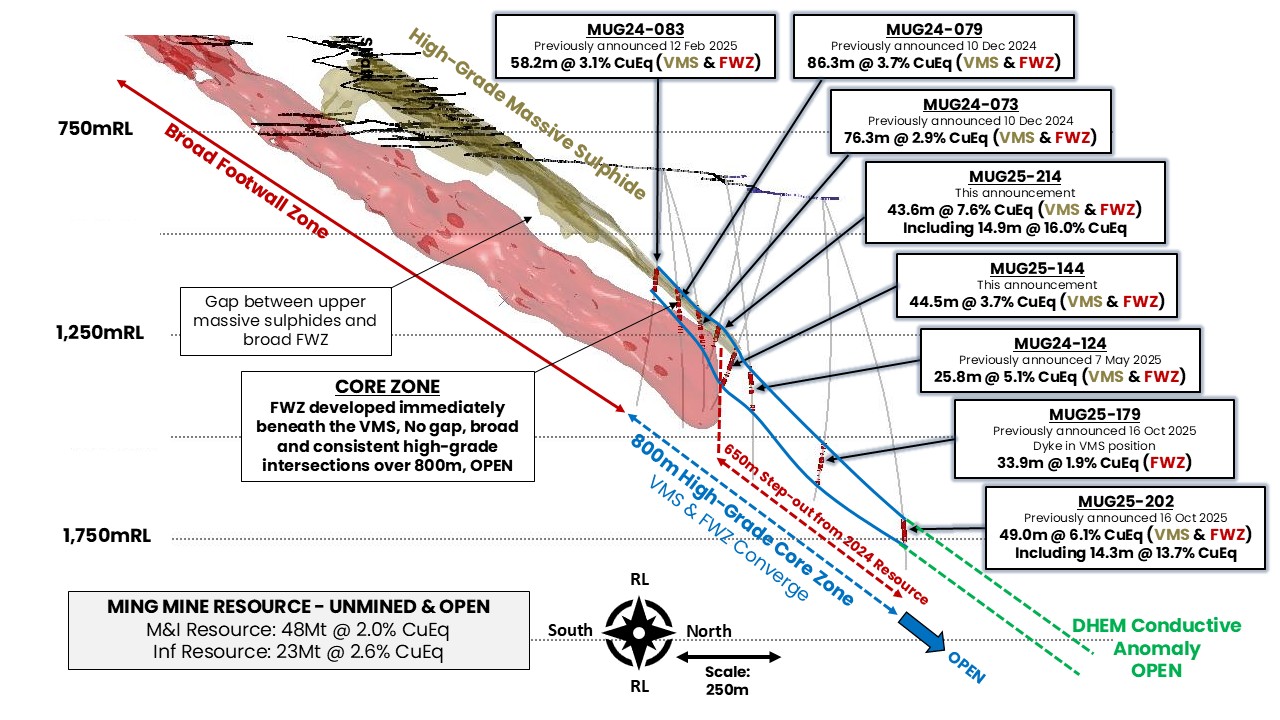
Figure 18:Long section through the Ming Mine highlighting the current ~800m strike of the extremely high-grade core zone, which remains open. The FWZ stringer style mineralisation is developed directly beneath the upper high-grade VMS. Clipping +/- 30m.
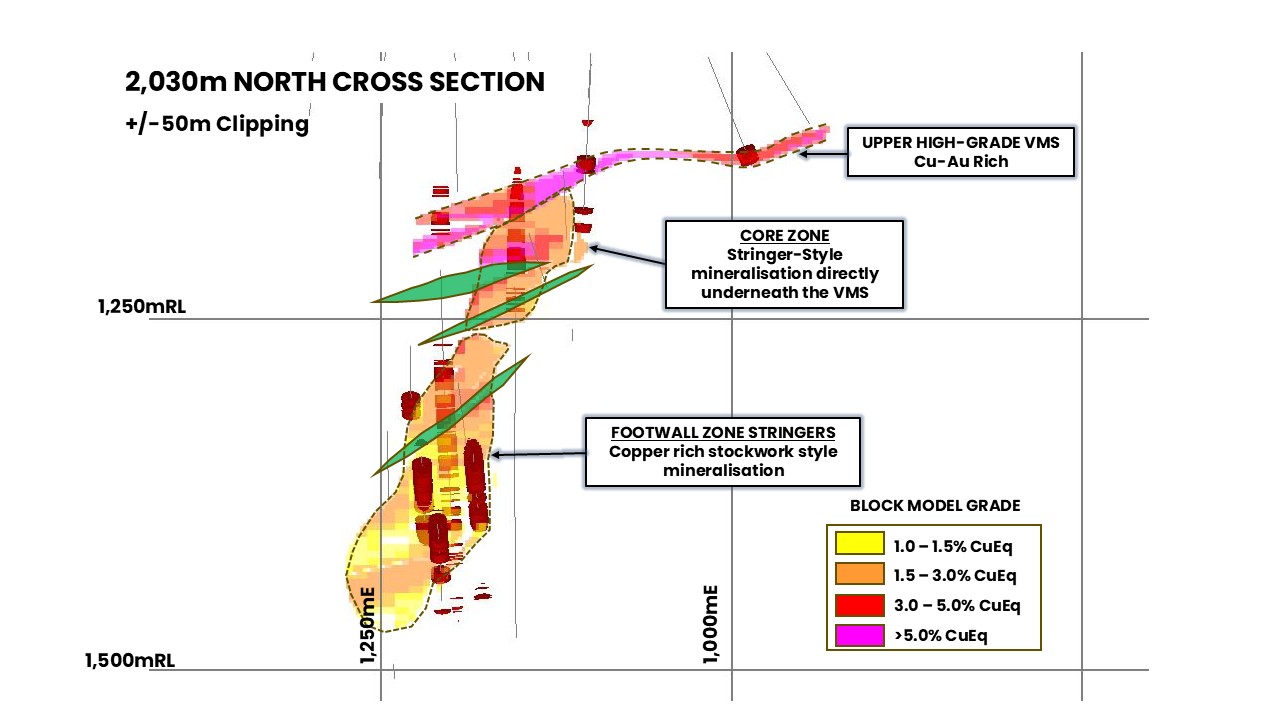
Figure 19: Cross section through the Ming block model showing key geological and mineralisation domains. Red drillholes are grades >0.5% copper. Interpreted post-mineral mafic dykes are shown in green. Clipping +/-50m.
Ming Drilling and Sampling Techniques
The Ming Deposit has been sampled exclusively by diamond drilling. A total of 1,334 holes for a total drilled meterage of 319,534m was used to estimate the November 2025 MRE.
Historic drill core was predominantly NQ (47.8mm diameter) with some BQ sized core (36mm diameter). All 37,110m of diamond drilling completed by FireFly was NQ2 (50.6mm diameter) and oriented using the Reflex Act III core orientation tool.
Core was sampled to a maximum length of 1m. The minimum sample length was 0.3m to accommodate geological boundaries or changes in mineralisation. All FireFly core was cut in half, with the non-assayed portion stored for future reference if required.
For further detail regarding drilling and sampling, please refer to Appendix B ‘Table 1 – Section 1 (Ming Mine)’.
Analytical Techniques
All assays completed by FireFly were undertaken at Eastern Analytical Ltd. in Springdale, Newfoundland. The laboratory is ISO 17025 accredited and utilises industry-standard preparation and analytical methodologies.
Sample preparation consisted of drying at 60o followed by crushing to ~80% passing -10 mesh. A riffle splitter was used to collect a representative 250g to 300g subsample. A ring mill was then used to pulverise the sample split to 95% passing -150 mesh.
Initial analysis for 34 elements was determined by Inductively Coupled Plasma (ICP). A 200mg subsample is totally digested in four acids and analysed by ICP-OES.
Where the upper detection limits were reached for select ore grade elements (Cu, Ag, Zn, Pb and Fe), the samples were then dissolved in a three-acid digest and analysed by atomic adsorption (AA). Gold content was determined by fire assay with AA finish.
All samples submitted by FireFly were subjected to rigorous internal and external QA/QC protocols. These include the routine inclusion of certified reference materials (standards), blank samples and duplicate samples. Sample pulps were also analysed at another independent laboratory (SGS) to confirm validity.
For further detail regarding analytical techniques, please refer to Appendix B ‘Table 1 – Section 1 (Ming Mine)’.
Ming Deposit Mineral Resource Estimation Methodology
Mineralisation Domains
Leapfrog software was used for lithology and mineralisation domain wireframing.
Twenty-two mineralisation domains are defined in the current model:
- Twelve of these represent massive sulphide and stringer deposits along and below the felsic contact (vein style domains).
- Six east dipping feeder structures (vein style domains).
- Two envelopes to capture the lower grade stringer mineralisation around massive sulphide and feeder zones described above (intrusion style domains).
- Two lower footwall zone (LFZ) domains, including an inner core of high-grade (LFZ_HG) and an outer lower-grade (LFZ_LG) domain.
These domains were based on mineralisation style and statistical analysis.
The overall stockwork zone is defined based on logged alteration and sulphide content. Within this geological envelope, the high-grade LFZ was refined using a 0.6% Cu lower cut-off, allowing consistent zones of internal waste in the high-grade core to be reclassified.
Data Treatment
The Mineral Resource estimation utilises 2m composites for all DD sampling data, composite residuals smaller than 0.3m have been removed from the estimation.
Detailed exploratory data analysis, variography, and model validation was carried out using Isatis and other software.
Treatment of extreme high grades were dealt with by using a cap grade strategy.
Industry-standard 3D geological modelling software was used for data compilation, calculating and coding composite values, estimating and reporting.
Estimation
All lodes are estimated using ordinary kriging (OK) with the same domains used to estimate Cu, Au, Ag, S and Zn. OK estimation was completed using an oriented search ellipsoid. A three-pass search strategy was employed for each estimated variable, with search directions aligned to the major, semi-major, and minor axes of the variogram.
During the first pass, search radius approximating between 70 to 100% of the variogram ranges were utilised, with a requirement of a minimum of 8 and a maximum of 12 composites. A maximum of 5 composites per drillhole was allowed for all domains with the exception of certain VMS lodes where a maximum of 3 composites were chosen to allow better definition of vertical grade zonation. For the second pass, the search radius was expanded to double the first pass. To ensure full estimation of all domains, a third pass search distance was increased to extents of the data and the minimum sample requirement reduced to 4 or 6 composites.
The parent block size of 10m(X) x 10m(Y) x 5m(Z) represents 30 to 50% of the average drill spacing in the zone classified as Indicated. Parent blocks have been sub-celled to 2.5m x 2.5m x 2.5m.
For further detail regarding the estimation methodology, please refer to Appendix B ‘Table 1 – Section 1 (Ming Mine)’.
Ming Deposit Mineral Resource Classification
Mineral Resources have been classified on the basis of confidence in the geological and grade continuity using the drilling density, and the distance to sample selections. These were evaluated individually for each mineralisation domain.
Measured Mineral Resources have been defined generally where the closest drillhole sample is within 15m and the average distance to samples used for estimation within 20m.
Indicated Mineral Resources where the closest drillhole sample is within 30m and the average distance to samples used for estimation within 40m.
Inferred Mineral Resources where the closest drillhole sample is within 90m or greater if there is enough geological and grade continuity. Material outside these criteria are constrained by boundary strings and do not form part of the Mineral Resource. Distance to historical workings has been used to downgrade the Mineral Resource category where required.
A Mineral Resource category smoothing has been applied to ensure category continuity and to remove isolated blocks or small zones and avoid mosaic-like patterns in the Mineral Resource classification.
This classification is considered appropriate given the confidence that can be gained from the existing data density and results from drilling.
A long section of the November 2025 MRE model showing Mineral Resource Categories is presented in Figure 20.
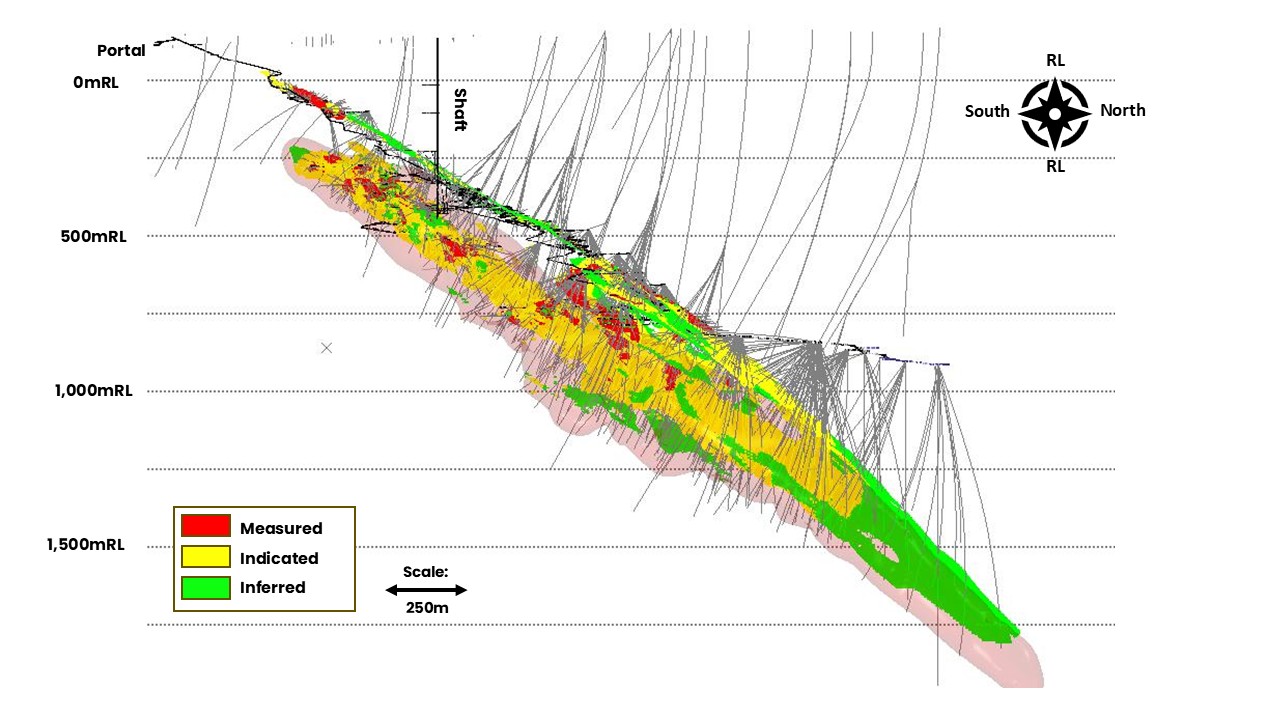
Figure 20: Long section showing the Mineral Resource Categories for the November 2025 MRE with all drillholes shown. This includes both historical drilling and all holes completed by FireFly since acquisition of the Project in October 2023.
Ming Cut-off Grade
The cut-off grade of 1% Cu has been calculated based on the likely input components of mining, processing, recovery and administration costs. Commodity prices used are well below current spot prices however have been maintained the same as the October 2024 MRE parameters to ensure like-for-like comparisons.
- Cu price of US$8,750 and 95% metallurgical recovery
- Au price US$2,500 and 85% metallurgical recovery
- Ag price US$25 and 85% metallurgical recovery
The gold-rich 1806 and 1807 VMS domains have been reported at a 1% CuEq cut-off.
Modifying Mining and Metallurgical Factors
The mineral resource is reported in-situ, however conservative economic factors and cut-off grades were applied. The cut-off grade used was 1% copper. Mining costs assumed in the cut-off grade calculation assume a combination of transverse and longitudinal long hole open stoping (LHOS) with paste backfill. Processing costs were guided by benchmarked operations that utilise floatation to produce a copper-gold concentrate for external extraction.
Recovery assumptions are based on the previous operations at Ming. Economic evaluation studies are in progress to further increase confidence in the cut-off grade and refine modifying factors applied.
In the opinion of the Company, all elements included in the metal equivalent calculation have a reasonable potential to be recovered and sold based on current market conditions, metallurgical test work, and the Company’s operational experience.
Little Deer Mineral Resource Estimate
The Little Deer Mineral Resource Estimate as of November 2025 is presented in Table 6. This estimate has been prepared in accordance with the JORC Code (2012 Edition) and Canadian National Instrument 43-101. The estimate was prepared by independent consulting group P&E Mining Consultants Inc. in conjunction with FireFly employees.
No additional drilling has been completed at Little Deer and the MRE remains unchanged from the previous estimate. For further details on the Little Deer Mineral Resource Estimate, please refer to the ASX announcement dated 29 October 2024 titled ‘Resource Increases 42% to 1.2Mt of contained metal at 2% Copper Eq.’
| | TONNES | COPPER | GOLD | SILVER | CuEq |
| | (Mt) | Grade | Metal | Grade | Metal | Grade | Metal | Grade |
| | | (%) | (‘000 t) | (g/t) | (‘000 oz) | (g/t) | (‘000 oz) | (%) |
| Measured | - | - | - | - | - | - | - | - |
| Indicated | 2.9 | 2.1 | 62 | 0.1 | 9 | 3.4 | 320 | 2.3 |
| TOTAL M&I | 2.9 | 2.1 | 62 | 0.1 | 9 | 3.4 | 320 | 2.3 |
| Inferred | 6.2 | 1.8 | 110 | 0.1 | 10 | 2.2 | 430 | 1.8 |
Table 6: Little Deer Mineral Resource Estimate as at November 2025. Note that this MRE remains unchanged from the previous MRE.
ABOUT FIREFLY METALS
FireFly Metals Ltd (ASX, TSX: FFM) is an emerging copper-gold company focused on advancing the high-grade Green Bay Copper-Gold Project in Newfoundland, Canada. The Green Bay Copper-Gold Project currently hosts a Mineral Resource prepared and disclosed in accordance with the 2012 Edition of the Australasian Code for Reporting of Exploration Results, Mineral Resources and Ore Reserves (JORC Code 2012) and Canadian National Instrument 43-101 - Standards of Disclosure for Mineral Projects (NI 43-101) of 50.4Mt of Measured and Indicated Mineral Resources at 2.0% for 1,016Kt CuEq and 29.3Mt of Inferred Mineral Resources at 2.5% for 722Kt CuEq. The Company has a clear strategy to rapidly grow the copper-gold Mineral Resource to demonstrate a globally significant copper-gold asset. FireFly has completed a 130,000m diamond drilling program.
FireFly holds a 70% interest in the high-grade Pickle Crow Gold Project in Ontario. The current Inferred Mineral Resource stands at 11.9Mt at 7.2g/t for 2.8Moz gold, with exceptional discovery potential on the 500km2 tenement holding.
The Company also holds a 90% interest in the Limestone Well Vanadium-Titanium Project in Western Australia.
For further information regarding FireFly Metals Ltd please visit the ASX platform (ASX:FFM) or the Company’s website www.fireflymetals.com.au or SEDAR+ at www.sedarplus.ca.
COMPLIANCE STATEMENTS
Foreign Resource Estimate – Green Bay Project (August 2023)
The Company first announced the foreign estimate of mineralisation for the Green Bay Project on 31 August 2023 (Foreign Estimate). At that time, the Mineral Resource Estimate was a foreign estimate prepared in accordance with Canadian National Instrument 43-101. A competent person had not done sufficient work to classify the Foreign Estimate as Mineral Resources in accordance with the JORC Code. It was uncertain that, following evaluation and/or further exploration work, that the Foreign Estimate would be able to be reported as Mineral Resources in accordance with the JORC Code.
The Foreign Estimate has now been superseded by the Mineral Resource Estimate prepared in accordance with the JORC Code (2012 Edition) presented in this announcement. The Foreign Estimate is referenced in this announcement for comparative purposes only.
Please refer to the ASX announcement dated 31 August 2023 titled ‘AuTECO to acquire Green Bay Copper-Gold Project in Newfoundland, Canada’ for supporting information and details regarding the Foreign Estimate.
Metal equivalents
Metal equivalents for the Mineral Resource Estimates have been calculated at a copper price of US$8,750/t, gold price of US$2,500/oz and silver price of US$25/oz. Individual Mineral Resource grades for the metals are set out in Appendix A of this announcement.
Metallurgical factors have been applied to the metal equivalent calculation. Copper recovery used was 95%. Historical production at the Ming Mine has a documented copper recovery of ~96%. Precious metal (gold and silver) metallurgical recovery was assumed at 85% on the basis of historical recoveries achieved at the Ming Mine in addition to historical metallurgical test work to increase precious metal recoveries.
In the opinion of the Company, all elements included in the metal equivalent calculation have a reasonable potential to be recovered and sold based on current market conditions, metallurgical test work, and the Company’s operational experience and, where relevant, historical performance achieved at the Green Bay project whilst in operation.
Copper equivalent was calculated based on the formula CuEq(%) = Cu(%) + (Au(g/t) x 0.82190) + (Ag(g/t) x 0.00822).
Mineral Resource Estimate – Little Deer
The Mineral Resource Estimate for Little Deer referred to in this announcement was first reported in the Company’s ASX announcement dated 29 October 2024, titled ‘Resource Increases 42% to 1.2Mt of contained metal at 2% Copper Eq.’
Mineral Resource Estimate – Pickle Crow Project
The Mineral Resource Estimate for the Pickle Crow Project referred to in this announcement was first reported in the Company’s ASX announcement dated 4 May 2023, titled ’High-Grade Inferred Gold Resource Grows to 2.8Moz at 7.2g/t‘.
Exploration Results
Previously reported Exploration Results at the Green Bay Copper-Gold Project referred to in this announcement were first reported in accordance with ASX Listing Rule 5.7 in FireFly’s ASX announcements dated 31 August 2023, 11 December 2023, 16 January 2024, 4 March 2024, 21 March 2024, 29 April 2024, 19 June 2024, 3 September 2024, 16 September 2024, 3 October 2024, 10 December 2024, 12 February 2025, 25 March 2025, 7 May 2025, 17 July 2025, 9 October 2025, 16 October 2025, and 27 October 2025, and as may be otherwise cross-referenced in this announcement.
Original Announcements
FireFly confirms that it is not aware of any new information or data that materially affects the information included in the original announcements referred to or cross-referenced in this announcement and that, in the case of Mineral Resource Estimates, all material assumptions and technical parameters underpinning the estimates in the original announcements continue to apply and have not materially changed. The Company confirms that the form and context in which the Competent Persons’ and Qualified Persons’ findings are presented have not been materially modified from the original market announcements.
COMPETENT PERSONS AND QUALIFIED PERSONS STATEMENTS
The information in this announcement that relates to the Ming Deposit Mineral Resource Estimate is based on and fairly represents information and supporting documentation prepared and compiled by Mr Michael Job, BSc (Geology), MSc (Geostatistics). Mr Job is a full-time employee of Cube Consulting Pty Ltd who specialises in mineral resource estimation, evaluation and exploration. Neither Mr Job nor Cube Consulting Pty Ltd holds any interest in FireFly Metals Ltd, its related parties, or in any of the mineral properties that are the subject of this announcement. Mr Job is a Fellow of the Australasian Institute of Mining and Metallurgy and has sufficient experience which is relevant to the style of mineralisation and type of deposit under consideration and to the activity which he is undertaking to qualify as a Competent Person as defined in the JORC Code 2012 and a Qualified Person as defined in NI 43-101. Mr Job has reviewed the contents of this ASX announcement and consents to the inclusion in this announcement of all technical statements based on his information in the form and context in which they appear.
The information in this announcement that relates to the Little Deer Mineral Resource Estimate is based on and fairly represents information and supporting documentation prepared and compiled by Mr Eugene Puritch, P.Eng., FEC, CET. Mr Puritch is President and a full-time associate of P&E Mining Consultants Inc. P&E Mining Consultants Inc. who specialises in mineral resource estimation, evaluation, mining and exploration. Neither Mr Puritch nor P&E Mining Consultants Inc. holds any interest in FireFly Metals Ltd, its related parties, or in any of the mineral properties that are the subject of this announcement. Mr Puritch is a member of the Professional Engineers Ontario and Professional Engineers and Geoscientists Newfoundland and Labrador, each of which is a Recognised Professional Organisation (RPO) under the JORC Code 2012, and has sufficient experience which is relevant to the style of mineralisation and type of deposit under consideration and to the activity which he is undertaking to qualify as a Competent Person as defined in the JORC Code 2012 and a Qualified Person as defined in NI 43-101. Mr Puritch has reviewed the contents of this ASX announcement and consents to the inclusion in this announcement of all technical statements based on his information in the form and context in which they appear.
All technical and scientific information in this announcement has been reviewed and approved by Group Chief Geologist, Mr Juan Gutierrez BSc, Geology (Masters), Geostatistics (Postgraduate Diploma), who is a Member and Chartered Professional of the Australasian Institute of Mining and Metallurgy and a Member of the Australian Institute of Geoscientists. Mr Gutierrez is a Competent Person as defined in the JORC Code 2012 and a Qualified Person as defined in NI 43-101. Mr Gutierrez is a full-time employee of, and holds securities in, the Company. Mr Gutierrez has sufficient experience that is relevant to the style of mineralisation and type of deposit under consideration and to the activity being undertaken to qualify as a Competent Person as defined in the JORC Code 2012 and a Qualified Person as defined in NI 43-101. Mr Gutierrez consents to the inclusion in this announcement of the matters based on his information in the form and context in which they appear.
FORWARD-LOOKING INFORMATION
This announcement may contain certain forward-looking statements and projections, including statements regarding FireFly’s plans, forecasts and projections with respect to its mineral properties and programs. Forward-looking statements may be identified by the use of words such as ’may‘, ’might‘, ’could‘, ’would‘, ’will‘, ’expect‘, ’intend‘, ’believe‘, ’forecast‘, ’milestone‘, ’objective‘, ’predict‘, ’plan‘, ’scheduled‘, ’estimate‘, ’anticipate‘, ’continue‘, or other similar words and may include, without limitation, statements regarding plans, strategies and objectives.
Although the forward-looking statements contained in this announcement reflect management’s current beliefs based upon information currently available to management and based upon what management believes to be reasonable assumptions, such forward-looking statements and projections are estimates only and should not be relied upon. They are not guarantees of future performance and involve known and unknown risks, uncertainties and other factors many of which are beyond the control of the Company, which may include changes in commodity prices, foreign exchange fluctuations, economic, social and political conditions, and changes to applicable regulation, and those risks outlined in the Company’s public disclosures.
The forward-looking statements and projections are inherently uncertain and may therefore differ materially from results ultimately achieved. For example, there can be no assurance that FireFly will be able to confirm the presence of Mineral Resources or Ore Reserves, that FireFly’s plans for development of its mineral properties will proceed, that any mineralisation will prove to be economic, or that a mine will be successfully developed on any of FireFly’s mineral properties. The performance of FireFly may be influenced by a number of factors which are outside of the control of the Company, its directors, officers, employees and contractors. The Company does not make any representations and provides no warranties concerning the accuracy of any forward-looking statements or projections, and disclaims any obligation to update or revise any forward-looking statements or projections based on new information, future events or circumstances or otherwise, except to the extent required by applicable laws.
APPENDIX A
Green Bay Copper-Gold Project Mineral Resources
Ming Deposit Mineral Resource Estimate
| | TONNES | COPPER | GOLD | SILVER | CuEq |
| | (Mt) | Grade | Metal | Grade | Metal | Grade | Metal | Grade |
| | | (%) | (‘000 t) | (g/t) | (‘000 oz) | (g/t) | (‘000 oz) | (%) |
| Measured | 6.3 | 1.5 | 94 | 0.3 | 50 | 1.9 | 388 | 1.7 |
| Indicated | 41.2 | 1.7 | 708 | 0.4 | 488 | 3.2 | 4,320 | 2.1 |
| TOTAL M&I | 47.5 | 1.7 | 802 | 0.4 | 537 | 3.1 | 4,708 | 2.0 |
| Inferred | 23.1 | 2.0 | 456 | 0.7 | 553 | 5.9 | 4,379 | 2.6 |
Little Deer Mineral Resource Estimate
| | TONNES | COPPER | GOLD | SILVER | CuEq |
| | (Mt) | Grade | Metal | Grade | Metal | Grade | Metal | Grade |
| | | (%) | (‘000 t) | (g/t) | (‘000 oz) | (g/t) | (‘000 oz) | (%) |
| Measured | - | - | - | - | - | - | - | - |
| Indicated | 2.9 | 2.1 | 62 | 0.1 | 9 | 3.4 | 320 | 2.3 |
| TOTAL M&I | 2.9 | 2.1 | 62 | 0.1 | 9 | 3.4 | 320 | 2.3 |
| Inferred | 6.2 | 1.8 | 110 | 0.1 | 10 | 2.2 | 430 | 1.8 |
GREEN BAY TOTAL MINERAL RESOURCE ESTIMATE
| | TONNES | COPPER | GOLD | SILVER | CuEq |
| | (Mt) | Grade | Metal | Grade | Metal | Grade | Metal | Grade |
| | | (%) | (‘000 t) | (g/t) | (‘000 oz) | (g/t) | (‘000 oz) | (%) |
| Measured | 6.3 | 1.5 | 94 | 0.3 | 50 | 1.9 | 388 | 1.7 |
| Indicated | 44.1 | 1.7 | 769 | 0.4 | 496 | 3.3 | 4,638 | 2.1 |
| TOTAL M&I | 50.4 | 1.7 | 863 | 0.3 | 546 | 3.1 | 5,026 | 2.0 |
| Inferred | 29.3 | 1.9 | 566 | 0.6 | 563 | 5.1 | 4,810 | 2.5 |
- FireFly Metals Ltd Mineral Resource Estimates for the Green Bay Copper-Gold Project, incorporating the Ming Deposit and Little Deer Complex, are prepared and reported in accordance with the JORC Code 2012 and NI 43-101.
- Mineral Resources have been reported at a 1.0% copper cut-off grade.
- Metal equivalents for the Mineral Resource Estimates have been calculated at a copper price of US$8,750/t, gold price of US$2,500/oz and silver price of US$25/oz. Metallurgical recoveries have been set at 95% for copper and 85% for both gold and silver. These assumptions are made of the basis of historical production at the Ming Mine and additional metallurgical test work. Copper equivalent was calculated based on the formula: CuEq(%) = Cu(%) + (Au(g/t) x 0.82190) + (Ag(g/t) x 0.00822).
- Totals may vary due to rounding.
APPENDIX B – JORC CODE, 2012 EDITION
Table 1 – Ming Mine
Section 1 - Sampling Techniques and Data: Ming Mine (Criteria in this section apply to all succeeding sections)
| Criteria | JORC Code explanation | Commentary |
| Sampling techniques | - Nature and quality of sampling (e.g. cut channels, random chips, or specific specialised industry standard measurement tools appropriate to the minerals under investigation, such as down hole gamma sondes, or handheld XRF instruments, etc). These examples should not be taken as limiting the broad meaning of sampling.
- Include reference to measures taken to ensure sample representivity and the appropriate calibration of any measurement tools or systems used.
- Aspects of the determination of mineralisation that are Material to the Public Report.
- In cases where ‘industry standard’ work has been done this would be relatively simple (e.g. ‘reverse circulation drilling was used to obtain 1m samples from which 3 kg was pulverised to produce a 30 g charge for fire assay’). In other cases, more explanation may be required, such as where there is coarse gold that has inherent sampling problems. Unusual commodities or mineralisation types (e.g. submarine nodules) may warrant disclosure of detailed information.
| - The deposit has been extensively sampled through diamond drilling (DD), conducted by both FireFly and previous operators. In total, 1,610 drillholes have been completed, amounting to 319,534 metres of drilling at depths ranging from 10 to 1,771 metres. Of this, FireFly contributed 354 DD holes totalling 116,794 metres.
- DD sample intervals are based on geological observations. All the core is sampled in 1m intervals with some smaller samples down to minimum core length of 0.3m to accommodate geological and mineralisation contacts. Half NQ diamond drill core was submitted for analysis.
- DD sampling by previous operators assumed to be to industry standard at that time.
The following is a summary of the core sampling procedure: - All sample collection, core logging, and specific gravity determinations were completed by FireFly under the supervision of a professionally qualified registered geologist.
- NQ core was marked for splitting during logging and is sawn using a diamond core saw with a mounted jig to assure the core is cut lengthwise into equal halves. Half core core sampling was used for BQ core. Historically, whole core was sampled at times.
- Half of the cut core is placed in clean individual plastic bags with the appropriate sample tag.
- QA/QC samples are inserted into the sample stream at prescribed intervals.
- The samples are then placed in rice bags for shipment to the offsite laboratory’s facility.
- The remaining half of the core is retained and incorporated into Firefly’s secure core library located on the property.
- FireFly drill analysis was completed at ISO-certified Eastern Analytical laboratories. The samples are dried, crushed, and pulverised. Samples are crushed to approximately -10 mesh and split using a riffle splitter to approximately 300 g. A ring mill is used to pulverize the sample split to 98% passing -150 mesh. Sample pulps and rejects are picked up at Eastern by FireFly staff and returned directly to the Project site. Sample rejects are securely stored at the FireFly site.
|
| Drilling techniques | - Drill type (e.g. core, reverse circulation, open-hole hammer, rotary air blast, auger, Bangka, sonic, etc) and details (e.g. core diameter, triple or standard tube, depth of diamond tails, face-sampling bit or other type, whether core is oriented and if so, by what method, etc).
| - Historic diamond drilling was predominately NQ (47.6 mm diameter) with some BQ (36mm) associated with grade control programs.
- FireFly diamond drilling exclusively NQ and NQ2 (47.6 mm and 50.6mm diameter respectively) size with core oriented by REFLEX ACT III core orientation tool. Except for 3 holes where the last 50-60 metres were completed with BQ tail due to bad ground and drilling difficulties.
|
| Drill sample recovery | - Method of recording and assessing core and chip sample recoveries and results assessed.
- Measures taken to maximise sample recovery and ensure representative nature of the samples.
- Whether a relationship exists between sample recovery and grade and whether sample bias may have occurred due to preferential loss/gain of fine/coarse material.
| - All care is taken to ensure the full recovery of the core, yet certain drilling conditions, such as broken ground, can impede 100% recovery.
- There is no known relationship between sample recovery and grade. Drilling conditions have been noted to be competent in historical reports. FireFly core recovery averages >95%.
|
| Logging | - Whether core and chip samples have been geologically and geotechnically logged to a level of detail to support appropriate Mineral Resource estimation, mining studies and metallurgical studies.
- Whether logging is qualitative or quantitative in nature. Core (or costean, channel, etc) photography.
- The total length and percentage of the relevant intersections logged.
| The following steps are completed during the core logging procedure: - Sample security and chain of custody start with the removal of core from the core tube and boxing of drill core at the drill site.
- The boxed core remains under the custody of the drill contractor until it is transported from the drill to the secure on-site core facility.
- Core boxes are opened and inspected to ensure correct boxing and labelling of the core by the drill contractor.
- The core is metre marked, cleaned and oriented with the orientation line drawn using the marks form REFLEX ACT III core orientation tool.
- The drill core is geologically logged, photographed, and then marked and tagged for sampling and splitting.
- Core logging describes variations in lithology, alteration and mineralisation.
- Data associated with core logging and related assay results and other downhole information including orientation surveys are recorded in the AcQuire database System.
- Measured parameters include structural orientation with respect to core axis, lost core as a percentage of recovered length, and fracture density, which are determined by the intensity and thickness of mineralisation at specific intervals.
- Each core sample is assigned a tag with a unique identifying number. Sample lengths are typically one metre but can depend on zone mineralogy and boundaries.
- Sample core that is not mineralised is marked in 1.0 metre lengths.
- Wing samples are marked at 0.5 metres and sampled at the extremities of mineralised intervals to ensure anomalous grades do not continue into the surrounding wall rock.
- 100% of the core is logged.
|
| Sub-sampling techniques and sample preparation | - If core, whether cut or sawn and whether quarter, half or all core taken.
- If non-core, whether riffled, tube sampled, rotary split, etc and whether sampled wet or dry.
- For all sample types, the nature, quality and appropriateness of the sample preparation technique.
- Quality control procedures adopted for all sub-sampling stages to maximise representivity of samples.
- Measures taken to ensure that the sampling is representative of the in-situ material collected, including for instance results for field duplicate/second-half sampling.
- Whether sample sizes are appropriate to the grain size of the material being sampled.
| - Most FireFly drilling is NQ and NQ2. 3 drillholes were completed with a BQ tail.
- For NQ diameter the core was sawn in half following a sample cutting line determined by geologists during logging and submitted for analysis on nominal 1m intervals or defined by geological boundaries determined by the logging geologist.
- Historic diamond drilling has been half core sampled.
- Samples are dried at approximately 60°C , crushed and pulverised. Samples are crushed in a Rhino jaw crusher to approximately 80% -10 mesh, and split using a riffle splitter to approximately 250-300g. The remainder of the sample is bagged, labelled and stored as coarse reject. A ring mill is used to pulverise the sample split to 95% passing -150 mesh. Sample pulps are picked up at Eastern Analytical by FireFly staff and returned directly to the Project site.
- For pre-FireFly samples, sample preparation, analytical procedures and QA/QC used on the property were reviewed by independent consultants WSP in 2018, stating in their report that sampling practices meet industry standards and display acceptable levels of accuracy and precision.
- All core sampled in the prospective intervals when required wing samples are marked from 0.5 metres up to 20m and sampled at the extremities of mineralised intervals to ensure anomalous grades do not continue into the surrounding wall rock.
- No purpose lab audit has been completed. FireFly personnel and external consultants have visited the Eastern Analytical facilities on several occasions and observed that lab practices, equipment overall cleanliness meets industry standards.
- Pre-FireFly, most of the BQ core was entirely crushed for the assays by Rambler Metals and Mining Canada Ltd. (Rambler).
- Field duplicates were completed using ¼ core and inserted into the sample series at a rate of 2% of samples. Analysis results were acceptable considering the style of mineralisation being heterogeneous with stockwork stringers of chalcopyrite.
|
| Quality of assay data and laboratory tests | - The nature, quality and appropriateness of the assaying and laboratory procedures used and whether the technique is considered partial or total.
- For geophysical tools, spectrometers, handheld XRF instruments, etc, the parameters used in determining the analysis including instrument make and model, reading times, calibrations factors applied and their derivation, etc.
- Nature of quality control procedures adopted (e.g. standards, blanks, duplicates, external laboratory checks) and whether acceptable levels of accuracy (i.e. lack of bias) and precision have been established.
| - All FireFly and Rambler results reported in this announcement were analysed by Eastern Analytical in Springdale, NL.
- 34 elements were determined by Inductively Coupled Plasma (ICP). A 200mg subsample is totally dissolved in four acids and analysed by ICP-OES.
- Ore grade elements, Cu, Zn, Pb, Fe and Ag are dissolved via 3 acid digestion and analysed by atomic adsorption (AA).
- Gold assays were determined by fire assay with atomic adsorption finish.
- As part of the QA/QC program duplicate, blank and Certified Reference Material (CRM) samples are inserted alternately. Blanks are inserted one every 50 samples. CRMs are inserted every 20 samples. Field duplicates are taken approximately one every 40 samples. Blanks and CRMs are also randomly inserted in zones of suspected high grades. The minimum insertion rate for CRMs is 5%, which FireFly adheres to. Historical data collected by Rambler was also subject to a similar rigorous QA/QC regime.
- In addition to the Company QAQC samples (described earlier) included within the batch the laboratory included its own CRMs (Certified Reference Materials), blanks and duplicates.
- Sample assay results continue to be evaluated through control charts, log sheets, sample logbooks and signed assay certificates to determine the nature of any anomalies or failures and failures were re-assayed at the laboratory.
|
| Verification of sampling and assaying | - The verification of significant intersections by either independent or alternative company personnel.
- The use of twinned holes.
- Documentation of primary data, data entry procedures, data verification, data storage (physical and electronic) protocols.
- Discuss any adjustment to assay data.
| - FireFly routinely sends sample pulps for independent umpire lab check to the SGS laboratory in Burnaby. Results correlate very well with Eastern Analytical results.
- There are no purpose twinned holes in the dataset but a comparison of the results of different drilling generations showed that results were comparable.
- FireFly logging data, assay certificates and other relevant information are stored in an AcQuire database and on a site server.
- All pre-FireFly logging data was completed, core marked up, logging and sampling data was entered directly into an MX deposit or Fusion database.
- FireFly is not aware of any adjustments made by Rambler to the assay data. Similarly, FireFly has not made any adjustments to assay data.
- WSP completed an independent audit in 2018 where a representative number of assay certificates were compared to digital assay database and no discrepancies were found.
|
| Location of data points | - Accuracy and quality of surveys used to locate drill holes (collar and down-hole surveys), trenches, mine workings and other locations used in Mineral Resource estimation.
- Specification of the grid system used.
- Quality and adequacy of topographic control.
| - Drill collars were surveyed by the FireFly mine survey crew upon completion of the drill program.
- The set-ups for the underground drill collars were marked by the FireFly mine survey crew, and the drilling contractor was expected to set up properly on line. A FireFly geologist checked the underground drill set-up during the drilling program to ensure accuracy.
- Downhole surveys are completed using a Reflex Sprint IQ gyro multi-shot instrument to provide azimuth and dip reading down the hole. The Reflex Sprint IQ gyro instrument is calibrated at least once a year to ensure accuracy of results.
- Previous drilling has been set-out and picked up in both national and local grids using a combination of GPS and Survey instruments and are assumed to be to industry standard. Directional surface holes completed using Devico® technology.
- The underground development has been picked up by surveyors creating high confidence in the topographic control which drillholes, both historical and recent, are referenced against.
- Collar coordinates are recorded in local mine grid. Survey data was collected in mine grid and in UTM grid (NAD83 Zone 21).
- Topographic control is from Digital Elevation Contours (DEM) 2019 and site surveyed DGPS pickups.
|
| Data spacing and distribution | - Data spacing for reporting of Exploration Results.
- Whether the data spacing, and distribution is sufficient to establish the degree of geological and grade continuity appropriate for the Mineral Resource and Ore Reserve estimation procedure(s) and classifications applied.
- Whether sample compositing has been applied.
| - Mineral Resources are based on a maximum of approximately 90m drill spacing. In specific zones it can be greater than 100m where there is enough evidence of grade and geological continuity. The data spacing and distribution is considered sufficient to establish geological and/or grade continuity appropriate for the Mineral Resource classifications to be applied.
- Core is sampled to geology contacts; sample compositing is not applied until the estimation stage.
|
| Orientation of data in relation to geological structure | - Whether the orientation of sampling achieves unbiased sampling of possible structures and the extent to which this is known, considering the deposit type.
- If the relationship between the drilling orientation and the orientation of key mineralised structures is considered to have introduced a sampling bias, this should be assessed and reported if material.
| - Most of the underground drill hole orientations were perpendicular to sub-perpendicular to the mineralisation but variable in places where low angle drilling to the mineralisation has been completed in zones without suitable drilling platforms.
- The drill orientation to mineralised structures is not thought to make a material difference in the Mineral Resource estimation as most intercept widths are interpreted to be close to true width.
|
| Sample security | - The measures taken to ensure sample security.
| - Core was placed in wooden core boxes close to the drill rig by the drilling contractor. The core was collected daily by the drilling contractor and delivered to the secure core logging facility on the Ming Mine site. Access to the core logging facility is limited to FireFly employees or designates.
|
| Audits or reviews | - The results of any audits or reviews of sampling techniques and data.
| - Regular reviews of DD sampling techniques are completed by Senior Geologists and Resource Geologists and conclude that sampling techniques are satisfactory and industry standard.
- All recent FireFly sample data has been extensively QAQC reviewed internally and externally.
- Pre-FireFly data audits were conducted as part of NI-43-101 resource estimation by independent consultants WSP in 2018. It was WSP’s opinion that the drilling, sampling and logging procedures put in place by Rambler met acceptable industry standards and that the information can be used for geological and resource modelling.
|
Section 2 - Reporting of Exploration Results: Ming Mine (Criteria in this section apply to all succeeding sections)
| Criteria | JORC Code explanation | Commentary |
| Mineral tenement and land tenure status | - Type, reference name/number, location and ownership including agreements or material issues with third parties such as joint ventures, partnerships, overriding royalties, native title interests, historical sites, wilderness or national park and environmental settings.
- The security of the tenure held at the time of reporting along with any known impediments to obtaining a license to operate in the area.
| - FireFly owns a mineral land assembly consisting of one map-staked mineral license (023175M) and two mining leases (141L and 188L) totalling 955.4 ha and registered in the name of FireFly Metals Canada Limited, a wholly owned subsidiary of FireFly Metals Limited. All of these mineral lands are contiguous and, in some cases, overlapping and are located in the area of the former Ming and Ming West mines. In early 2015 the mineral license 023175M replaced the original license 014692M by claim reduction as requested by Rambler.
- FireFly holds all the permits required to operate the Ming Mine.
- All lands are in good standing with the Provincial Government, and FireFly is up to date with respect to lease payments (for leases) and required exploration expenditure (for licenses).
|
| Exploration done by other parties | - Acknowledgment and appraisal of exploration by other parties.
| - Ming Mine Early History: Auriferous sulphides and copper was found in the area in 1905 by Enos England.
- The Main Mine sulphide zone was found in 1935 about 600ft north of the Enos England discovery. In 1940, the Newfoundland government drilled eighteen diamond drill holes totalling 5,000ft.
- An airborne electromagnetic survey was flown from 1955 to 1956.
- The Ming Mine was discovered in 1970 by a helicopter borne AEM system. A large low-grade stringer type copper deposit was later discovered in the footwall 300ft to 500ft below the Ming mineralisation during mining operations and delineated by 36 diamond drill holes. Mining ceased at the Ming Mine in 1982 because of low copper prices.
- In 1988, the property was awarded to the Rambler Joint Venture Group (a Consortium of Teck Exploration, Petromet Resources Ltd, and Newfoundland Exploration Company Ltd). Exploration consisted of ground geophysics and soil geochemistry, resulting in discovery of the Ming West deposit. 48 diamond drill holes (25,534ft) were completed
- Altius Minerals Corporation: Under the terms of an option to purchase agreement with Ming Minerals, Altius conducted exploration on the Rambler property in 2001, 2003, and 2004. In 2001, a lithogeochemical program was initiated to chemically fingerprint rocks of the hanging wall and footwall to the sulphide deposits.
- Rambler Metals and Mining PLC: Rambler Metals and Mining PLC was a UK-based company listed on London’s Alternate Investment Market (AIM). Rambler held a 100% interest in the Ming property and between 2005 and 2023 and conducted a multi-phase diamond drilling program consisting of surface drilling, directional drilling, and underground delineation drilling. A total of 220,704m from 1,365 diamond drill holes were completed by Rambler. Between 2012 and 2022 the Ming Mine produced 3Mt at 1.86% Cu and 0.71 Au for total of 55Kt of copper and 68Koz of gold.
- The Ming Mine was placed on care and maintenance in February 2023.
- In October 2023, FireFly (then named AuTECO Minerals Ltd) acquired the Project under the sales and investment solicitation process (SISP) ordered by the Supreme Court of Newfoundland and Labrador in Canada on 15 March 2023 as part of the restructuring proceedings of Rambler Group under the Companies’ Creditors Arrangement Act (Canada).
- FireFly conducted drilling to test down plunge extent of VMS and footwall stringer lodes.
- An underground exploration drive has been completed to allow further drilling at more favourable drill angles.
|
| Geology | - Deposit type, geological setting and style of mineralisation.
| - The Green Bay Project is a Noranda-type Volcanogenic Massive Sulphide (VMS) hosted by Cambrian-Ordovician metavolcanic and metasedimentary rocks of the Pacquet Harbour Group. The style of mineralisation, alteration, host rock, and tectonism most closely resemble other VMS deposits throughout the world. The deposit consists of several individual massive sulphide lenses and their underlying stockwork zones. It is thought that the stockwork zone represents the near surface channel ways of a submarine hydrothermal system and the massive sulphide lens represents the accumulation of sulphides precipitated from the hydrothermal solutions, on the sea floor, above and around the discharge vent. The Ming Deposits are polymetallic (Cu, Au, Ag ± Zn) massive sulphides that occur along the flank of a felsic dome. The Ming Deposits have undergone strong deformation and upper greenschist to amphibolite facies metamorphism. The massive sulphide bodies are now thin and elongate down the plunge of the regional lineation (30-35ºNE). Typical aspect ratios of length down-plunge to width exceed 10:1, and the bodies exhibit mild boudinage along the plunge. The foot wall stock work comprises mainly of quartz-sericite-chlorite schist, which hosts disseminated and stringer pyrite and chalcopyrite with minor sphalerite, galena, and pyrrhotite with locally significant gold contents that could represent a discordant stockwork stringer feeder zone. The mineralisation is crosscut by younger mafic dykes.
|
| Drill hole Information | - A summary of all information material to the understanding of the exploration results including a tabulation of the following information for all Material drill holes:
- easting and northing of the drill hole collar
- elevation or RL (Reduced Level – elevation above sea level in meters) of the drill hole collar
- dip and azimuth of the hole
- down hole length and interception depth
- hole length.
- If the exclusion of this information is justified on the basis that the information is not Material and this exclusion does not detract from the understanding of the report, the Competent Person should clearly explain why this is the case.
| - No new exploration results are reported. Please refer to the Compliance Statements in this announcement for details of previous exploration results reported.
|
| Data aggregation methods | - In reporting Exploration Results, weighting averaging techniques, maximum and/or minimum grade truncations (e.g. cutting of high grades) and cut-off grades are usually Material and should be stated.
- Where aggregate intercepts incorporate short lengths of high-grade results and longer lengths of low-grade results, the procedure used for such aggregation should be stated and some typical examples of such aggregations should be shown in detail.
- The assumptions used for any reporting of metal equivalent values should be clearly stated.
| - No new exploration results are reported. Please refer to the Compliance Statements in this announcement for details of previous exploration results reported.
- Metal equivalent results have been calculated at a copper price of US$8,750/t, gold price of US$2,500/oz, silver price of US$25/oz
- Metallurgical recoveries have been set at 95% for copper and 85% for both gold and silver. These assumptions are made of the basis of historical production at the Ming Mine and additional metallurgical test work.
- FireFly has completed additional metallurgical test work that may support improved recoveries, however the October 2024 MRE assumptions have been used to make the November 2025 MRE comparable.
- CuEq(%) = Cu(%) + (Au(g/t) x 0.82190) + (Ag(g/t) x 0.00822)
|
| Relationship between mineralisation widths and intercept lengths | - These relationships are particularly important in the reporting of Exploration Results.
- If the geometry of the mineralisation with respect to the drill hole angle is known, its nature should be reported.
- If it is not known and only the down hole lengths are reported, there should be a clear statement to this effect (e.g. ‘down hole length, true width not known’).
| - No new exploration results are reported. Please refer to the Compliance Statements in this announcement for details of previous exploration results reported.
|
| Diagrams | - Appropriate maps and sections (with scales) and tabulations of intercepts should be included for any significant discovery being reported These should include, but not be limited to a plan view of drill hole collar locations and appropriate sectional views.
| - Maps and sections are included in the body of this announcement as deemed appropriate by the Competent Person.
|
| Balanced reporting | - Where comprehensive reporting of all Exploration Results is not practicable, representative reporting of both low and high grades and/or widths should be practiced to avoid misleading reporting of Exploration Results.
| - No new exploration results are reported. Please refer to the Compliance Statements in this announcement for details of previous exploration results reported.
|
| Other substantive exploration data | - Other exploration data, if meaningful and material, should be reported including (but not limited to): geological observations; geophysical survey results; geochemical survey results; bulk samples – size and method of treatment; metallurgical test results; bulk density, groundwater, geotechnical and rock characteristics; potential deleterious or contaminating substances.
| - No new exploration results are reported. Please refer to the Compliance Statements in this announcement for details of previous exploration results reported.
|
| Further work | - The nature and scale of planned further work (e.g. tests for lateral extensions or depth extensions or large-scale step-out drilling).
- Diagrams clearly highlighting the areas of possible extensions, including the main geological interpretations and future drilling areas, provided this information is not commercially sensitive.
| - FireFly will be conducting drill testing of additional mineralisation as well as step out drilling of existing lodes to further enhance the Mineral Resources quoted in this announcement. More information is presented in the body of this announcement.
- Diagrams in the main body of this announcement show areas of possible Mineral Resource extension on existing lodes.
- The Company has continued to mine an exploration drive to enable effective drill testing of down plunge extensions.
|
Section 3 – Estimation and Reporting of Mineral Resources: Ming Mine (Criteria in this section apply to all succeeding sections)
| Criteria | JORC Code explanation | Commentary |
| Database Integrity | - Measures taken to ensure that data has not been corrupted by, for example, transcription or keying errors, between its initial collection and its use for Mineral Resource estimation purposes.
- Data validation procedures used.
| - FireFly sampling and logging data is digitally entered into AcQuire database using a laptop. There are checks in place to avoid duplicate holes and sample numbers.
- All holes used in the Mineral Resource Estimate have been validated individually for collar, downhole survey, geology and sample integrity by FireFly geologists.
|
| Site visits | - Comment on any site visits undertaken by the Competent Person and the outcome of those visits.
- If no site visits have been undertaken indicate why this is the case.
| - The Competent Person for the Ming Resource visited the deposit site in August 2025.
- The Competent Person reviewed site procedures and processes related to data collection for the preparation of the Mineral Resource Estimate. The Competent Person also viewed the mineralisation underground and confirmed it is consistent with the geological interpretation.
|
| Geological interpretation | - Confidence in (or conversely, the uncertainty of) the geological interpretation of the mineral deposit.
- Nature of the data used and of any assumptions made.
- The effect, if any, of alternative interpretations on Mineral Resource estimation.
- The use of geology in guiding and controlling Mineral Resource estimation.
- The factors affecting continuity both of grade and geology.
| - The geological framework and the factors influencing mineralisation are comprehensively understood, attributable to an extensive mining history and parallels to other regional deposits.
- Validated diamond drill hole data was used to inform the interpretation including lithological, alteration, weathering, mineralisation and structural logging. The same data was used in the Mineral Resource estimation.
- The Competent Person believes that, given the characteristics of the deposit, alternative geological interpretations are unlikely to significantly differ from the present model.
- Diamond core enabled characterisation of mineralisation. Geological and structural contacts orientation measurements helped to inform orientation of lodes. Stacked massive sulphide lodes are consistently correlated across drill holes based on an orientation that is similar to the neighbouring contact between the footwall felsic tuff and hanging wall mafic volcanics. The lower footwall stockwork envelopes are defined by alteration assemblages, dominant sulphide species, the frequency of sulphide stringers and grade distribution and continuity.
- Post-mineralisation mafic dykes cross-cut the mineralised domains. Dykes typically occur in consistent orientations with different intrusive generations able to be characterised by multi-element data.
|
| Dimensions | - The extent and variability of the Mineral Resource expressed as length (along strike or otherwise), plan width, and depth below surface to the upper and lower limits of the Mineral Resource.
| - The extent of mineralisation is 3,000m along the down dip direction, 500m along strike and 400m wide.
- The mineralisation is contained within 4 sulphide stringers envelopes and 15 individual massive to semi-massive and stringer sulphide tabular lodes that vary between 1m and 18m in thickness.
- There are width and grade variations in all modelled and estimated structures along strike and down-dip. The deposit remains open at depth with strike potential.
|
| Estimation and modelling techniques | - The nature and appropriateness of the estimation technique(s) applied and key assumptions, including treatment of extreme grade values, domaining, interpolation parameters and maximum distance of extrapolation from data points. If a computer assisted estimation method was chosen include a description of computer software and parameters used.
- The availability of check estimates, previous estimates and/or mine production records and whether the Mineral Resource estimate takes appropriate account of such data.
- The assumptions made regarding recovery of by-products.
- Estimation of deleterious elements or other non-grade variables of economic significance (e.g. sulphur for acid mine drainage characterisation).
- In the case of block model interpolation, the block size in relation to the average sample spacing and the search employed.
- Any assumptions behind modelling of selective mining units.
- Any assumptions about correlation between variables.
- Description of how the geological interpretation was used to control the resource estimates.
- Discussion of basis for using or not using grade cutting or capping.
- The process of validation, the checking process used, the comparison of model data to drill hole data, and use of reconciliation data if available.
| - FireFly geological staff used Leapfrog software for lithology and mineralisation domain wireframing. The subsequent wireframe interpretations were reviewed and validated by the Competent Person and minor adjustments were made prior to using the interpretations as input to the Mineral Resource.
- The Lithology model comprises a surface that delineates the boundary between the hanging wall mafic and footwall felsic packages, along with twenty-four gabbro dykes and five felsic intrusives.
- 22 mineralisation domains are defined in the current model:
- 12 of these represent massive sulphide and stringer deposits along and below the felsic contact (vein style domains).
- Six east dipping feeder structures (vein style domains).
- Two envelopes to capture the lower grade stringer mineralisation around massive sulphide and feeder zones described above (intrusion style domains).
- Two lower footwall zone (LFZ) domains, including an inner core of high-grade (LFZ_HG) and an outer lower-grade (LFZ_LG) domain.
- The overall stockwork zone is defined based on logged alteration and sulphide content. Within this geological envelope, the high-grade LFZ was refined using a 0.6% Cu lower cut-off, allowing consistent zones of internal waste in the high-grade core to be reclassified.
- The Mineral Resource estimation utilises 2m composites for all DD sampling data. Composite residuals smaller than 0.3m have been removed from the estimation.
- Detailed exploratory data analysis, variography, and model validation is carried out using Snowden Supervisor and industry standard software, including Datamine.
- Data compilation, calculating and coding composite values, estimating and reporting was completed utilising industry-standard software.
- All lodes are estimated using ordinary kriging (OK) with the same domains used to estimate Cu, Au, Ag, S and Zn. OK estimation was completed using an oriented search ellipsoid. A three-pass search strategy was employed for each estimated variable, with search directions aligned to the major, semi-major, and minor axes of the variogram. During the first pass, search radius approximating between 70 to 100% of the variogram ranges were utilised, with a requirement of a minimum of 8 and a maximum of 12 composites. A maximum of 5 composites per drillhole was allowed for all domains with the exception of certain VMS lodes where a maximum of 3 composites was chosen to allow better definition of vertical grade zonation. For the second pass, the search radius was expanded to double the first pass. To ensure full estimation of all domains, a third pass search distance was increased to extents of the data and the minimum sample requirement reduced to 4 or 6 composites.
- Block model volumes were compared to wireframe volumes to validate sub-blocking.
- Where OK estimates were used, treatment of extreme high grades were dealt with by using a cap grade strategy.
- Previous descriptions and photographs of sulphide mineralisation and dyke geometries have informed the interpretation of geological domains. These historical records have been utilised to refine the understanding of the spatial distribution and orientation of mineralised zones. The data obtained from previous descriptions and estimates have been integrated into the current model, ensuring that critical geological features influencing Mineral Resource estimation are accurately represented. Necessary adjustments were made where contemporary data and advanced modelling techniques provided an opportunity for refinement.
- Gold and silver were recovered historically and therefore justified for inclusion in Cu equivalent calculation.
- The following deleterious elements have been modelled: Arsenic, antimony, lead, and selenium.
- The parent block size of 10m(X) x 10m(Y) x 5m(Z) represents 30 to 50% of the average drill spacing in the zone classified as indicated. Parent blocks have been sub-celled to 2.5m x 2.5m x 2.5m.
- Block sizes reflect the selective mining units (SMU) that are appropriate based on anticipated the mining method of long hole open stoping (LHOS).
- No assumptions have been made about correlation between variables in the estimate.
- Hard boundaries were utilized for all domains.
- Blocks coded as post-mineralisation gabbro or felsic intrusive units were not estimated in the model.
- Top cuts were applied in the Estimation stage and determined by a range of statistical techniques including: Disintegration analysis of Histogram, Log-probability, Mean-CV and Cumulative metal plots.
- Top cuts vary by domain and element. Top cuts are considered light and have a minimal effect on the global outcome.
- The Mineral Resource Estimate was validated based on a combination of visual, graphical and reconciliation style validations summarised as:
- Visual validation of the lode and lithology coding of both the composite data and the block model.
- Comparison of lode wireframe volumes to block model volumes.
- Visual validation of Mineral Resource Estimate against composite data in plan, section, and in 3D.
- Statistical comparison of composites versus all estimates in block model: trend analysis plots for each domain are produced by Northing / Easting / RL. The Mineral Resource Estimate generally shows a reasonable reflection of the composites where there are high numbers of composites used in the estimate. Where smaller numbers of composites are input to the block estimate, local differences may be seen between the block and composite grades however the global estimates remain robust.
|
| Moisture | - Whether the tonnages are estimated on a dry basis or with natural moisture, and the method of determination of the moisture content.
| - Tonnages are reported on a dry basis with sampling and analysis having been conducted to avoid water content density issues.
|
| Cut-off parameters | - The basis of the adopted cut-off grade(s) or quality parameters applied.
| - The cut-off grade of 1% Cu has been calculated based on the key input components of mining, processing, recovery and administration costs. Benchmark industry averages and forward-looking forecast costs and physicals form the basis of the cut-off grade calculations including:
- Cu price of US$8,750 and 95% metallurgical recovery.
- Au price US$2,500 and 85% metallurgical recovery
- Ag price US$25 and 85% metallurgical recovery
|
| Mining factors or assumptions | - Assumptions made regarding possible mining methods, minimum mining dimensions and internal (or, if applicable, external) mining dilution. It is always necessary as part of the process of determining reasonable prospects for eventual economic extraction to consider potential mining methods, but the assumptions made regarding mining methods and parameters when estimating Mineral Resources may not always be rigorous. Where this is the case, this should be reported with an explanation of the basis of the mining assumptions made.
| - The anticipated mining method is a combination of transverse and longitudinal long hole open stoping (LHOS). This mining method has been used to identify sensible SMU units when determining block sizes in the model.
- Total extraction has been assumed with a future paste backfill system likely.
- This has been factored into the cut-off grade calculations.
|
| Metallurgical factors or assumptions | - The basis for assumptions or predictions regarding metallurgical amenability. It is always necessary as part of the process of determining reasonable prospects for eventual economic extraction to consider potential metallurgical methods, but the assumptions regarding metallurgical treatment processes and parameters made when reporting Mineral Resources may not always be rigorous. Where this is the case, this should be reported with an explanation of the basis of the metallurgical assumptions made.
| - Recent metallurgical test work completed by Firefly at SGS Lakefield laboratories shows that metal recoveries to final copper concentrate from all samples averaged +98% Copper, +75% Gold and +78% Silver. Recent gravity and conventional leach testing of the pyrite flotation tails has achieved further improvements in precious metals recovery, with gold increasing to +85% and +84% for silver.
- Historical data was collected over the years at the Nugget Pond shows that coarser grind and ore feed rate to the mill had moderate impact on the overall recoveries. In general, copper recovery did not vary with head grade and was mostly between 95% to 97% copper.
- Gold and silver recoveries increased as head grades increased with historical recoveries ranging between 65% and 75% for gold and silver, however additional studies are currently underway to improve the historical precious metal recoveries.
|
| Environmental factors or assumptions | - Assumptions made regarding possible waste and process residue disposal options. It is always necessary as part of the process of determining reasonable prospects for eventual economic extraction to consider the potential environmental impacts of the mining and processing operation. While at this stage the determination of potential environmental impacts, particularly for a green fields project, may not always be well advanced, the status of early consideration of these potential environmental impacts should be reported. Where these aspects have not been considered this should be reported with an explanation of the environmental assumptions made.
| - The Ming Mine was in operation from 2012 to 2023 and is currently on care and maintenance. It is considered that there are no significant environmental factors affecting the Ming property at this time.
- The mine is currently fully permitted for operations at 500ktpa.
- FireFly is advancing an expansion project, that includes the previously approved underground Ming Mine. The Company has successfully completed the provincial Environmental Assessment (EA) process under the Newfoundland and Labrador Environmental Protection Act (NL EPA) for an initial upscaled restart mining operation involving a plant with a throughput capacity of up to 1.8Mtpa and has been formally released from further environmental review with conditions. Investors are cautioned that the plant capacity is a technical specification forming part of the environmental submission and not a forecast of the estimated production of the mining operation. The mining operation’s forecast production will not be estimated until such time as the Company has prepared and announced an economic study. Should a larger scale case be adopted than contemplated by the Environmental Release, further assessment will be required by government agencies.
|
| Bulk density | - Whether assumed or determined. If assumed, the basis for the assumptions. If determined, the method used, whether wet or dry, the frequency of the measurements, the nature, size and representativeness of the samples.
- The bulk density for bulk material must have been measured by methods that adequately account for void spaces (vugs, porosity, etc.), moisture and differences between rock and alteration zones within the deposit.
- Discuss assumptions for bulk density estimates used in the evaluation process of the different materials.
| - A bulk density database, comprising a total of 20,080 measurements, was used to inform densities used in the model. Of these, 8,070 were collected historically and 12,010 collected by FireFly.
- The water displacement method was used to determine bulk density, a sample is weighted to determine the dry mass and weighted submerged in water to determine the volume using the Archimedes principle. The data was categorized into groups based on mineralisation and lithological domains, and statistical analysis was conducted to compare historic and FireFly datasets. The results demonstrated good consistency between the two datasets.
- Individual bulk densities are applied in accordance with specific lithologies and mineralisation domains based on calculated mean and median of the overall density dataset.
- VMS lodes with adequate data density were estimated directly from measurement data using inverse distance weighting.
- Density values for the lower footwall zone domains were assigned using a sulphur-based regression formula, reflecting the strong correlation between sulphide content and bulk density measurements.
|
| Classification | - The basis for the classification of the Mineral Resources into varying confidence categories.
- Whether appropriate account has been taken of all relevant factors (i.e. relative confidence in tonnage/grade estimations, reliability of input data, confidence in continuity of geology and metal values, quality, quantity and distribution of the data).
- Whether the result appropriately reflects the Competent Person’s view of the deposit.
| - Mineral Resources have been classified on the basis of confidence in the geological and grade continuity using the drilling density, and the distance to sample selections. These were evaluated individually for each mineralisation domain.
- Measured Mineral Resources have been defined generally where the closest drillhole sample is within 15m and the average distance to samples used for estimation within 20m.
- Indicated Mineral Resources where the closest drillhole sample is within 30m and the average distance to samples used for estimation within 40m.
- Inferred Mineral Resources where the closest drillhole sample is within 90m or greater if there is enough geological and grade continuity. Material outside this criteria are constrained by boundary strings and do not form part of the Mineral Resource. Distance to historical workings has been used to downgrade the Mineral Resource category where required.
- A Mineral Resource category smoothing has been applied to ensure category continuity and to remove isolated blocks or small zones and avoid mosaic like patters in the Mineral Resource classification.
- This classification is considered appropriate given the confidence that can be gained from the existing data density and results from drilling.
- The reported Resource appropriately reflects the Competent Person’s view of the deposit and the current level of risk associated with the Project to date.
|
| Audits or reviews | - The results of any audits or reviews of Mineral Resource estimates.
| - The mineralisation domaining, estimation parameters, classification and reporting have been reviewed internally by FireFly employees, with no adverse finds noted. An external consulting group has reviewed the Mineral Resource model.
|
| Discussion of relative accuracy/ confidence | - Where appropriate a statement of the relative accuracy and confidence level in the Mineral Resource estimate using an approach or procedure deemed appropriate by the Competent Person. For example, the application of statistical or geostatistical procedures to quantify the relative accuracy of the resource within stated confidence limits, or, if such an approach is not deemed appropriate, a qualitative discussion of the factors that could affect the relative accuracy and confidence of the estimate.
- The statement should specify whether it relates to global or local estimates, and, if local, state the relevant tonnages, which should be relevant to technical and economic evaluation. Documentation should include assumptions made and the procedures used.
- These statements of relative accuracy and confidence of the estimate should be compared with production data, where available.
| - There is good confidence in the data quality, drilling methods and analytical results. The available geology and assay data correlate well, and the geological continuity has been demonstrated.
- The Mineral Resources constitute a global resource estimate.
|
1 Metal equivalent reported in this announcement have been calculated at a copper price of US$8,750/t, gold price of US$2,500/oz, silver price of US$25/oz and zinc price of US$2,500/t. Metallurgical recoveries have been set at 95% for copper, 85% for precious metals and 50% for zinc. These assumptions are made of the basis of historical production at the Ming Mine and additional metallurgical test work. CuEq(%) = Cu(%) + (Au(g/t) x 0.82190) + (Ag(g/t) x 0.00822) + (Zn(%) x 0.15038). In the opinion of the Company, all elements included in the metal equivalent calculation have a reasonable potential to be recovered and sold based on current market conditions, metallurgical test work, and historical performance achieved at the Green Bay project whilst in operation.
2 Discovery cost is defined as total underground drilling cost, assay costs and other related consumables divided by the additional CuEq metal tonnes added since the October 2024 MRE.
Photos accompanying this announcement are available at
https://www.globenewswire.com/NewsRoom/AttachmentNg/8ff9c7dd-6d87-49d9-b512-6a84595920b7
https://www.globenewswire.com/NewsRoom/AttachmentNg/a4b4a085-c764-4dca-b463-db59fbd1e274
https://www.globenewswire.com/NewsRoom/AttachmentNg/be400b4f-1c50-4e2e-ad6b-af759ac8a31f
https://www.globenewswire.com/NewsRoom/AttachmentNg/8383c3a7-15ac-4875-8255-0f9d869eccd2
https://www.globenewswire.com/NewsRoom/AttachmentNg/4f52d5c7-3793-469d-ab9a-3e89adc9b650
https://www.globenewswire.com/NewsRoom/AttachmentNg/767b73ba-147c-40f3-8a53-703f39f92a50
https://www.globenewswire.com/NewsRoom/AttachmentNg/87a799a1-b6cd-4005-b3d5-da87ffede238
https://www.globenewswire.com/NewsRoom/AttachmentNg/42ec59a6-9f12-491d-9dad-1c1648e6c73d
https://www.globenewswire.com/NewsRoom/AttachmentNg/e26c224a-c72b-4c59-ab21-137691312cec
https://www.globenewswire.com/NewsRoom/AttachmentNg/090a753c-c2b0-4164-8b08-0d184f3a4de5
https://www.globenewswire.com/NewsRoom/AttachmentNg/2abe8563-2816-4959-87a5-904172c9f3bf
https://www.globenewswire.com/NewsRoom/AttachmentNg/833398ba-9329-490c-9f17-8181a5f3900a
https://www.globenewswire.com/NewsRoom/AttachmentNg/b2fa984c-9546-49c4-850e-a569750ca94a
https://www.globenewswire.com/NewsRoom/AttachmentNg/86699ac5-02c0-49b6-acc4-50e41210c8c4
https://www.globenewswire.com/NewsRoom/AttachmentNg/b2a952ba-1525-4b30-9e02-1b2575407cb2
https://www.globenewswire.com/NewsRoom/AttachmentNg/061c5f54-8b0a-4983-95af-5093a1899d85
https://www.globenewswire.com/NewsRoom/AttachmentNg/a46d4fab-dcbb-475e-a1d1-4261aec28188
https://www.globenewswire.com/NewsRoom/AttachmentNg/1cf9d612-d985-47e7-98a6-28f699db7166
https://www.globenewswire.com/NewsRoom/AttachmentNg/643dedee-2ada-4f6f-9b91-8691ce0abcc4
https://www.globenewswire.com/NewsRoom/AttachmentNg/ed3633fd-ec8d-49c8-9ff5-f9cdf2701fb9


Figure 1
Year-on-Year increase in Mineral Resource contained copper equivalent metal since acquisition of the Green Bay Copper-Gold Project in 2023. Please refer to compliance statements for metal equivalent details.
Figure 2
Year on Year changes between the October 2024 MRE and November 2025 MRE for Tonnes, Grade and Contained Metal. This latest estimate has seen significant year-on-year increases in tonnes, grades and metal content.
Figure 3
Long section of the Ming Deposit MRE extent and new drilling completed since the previous October 2024 MRE. The MRE remains open and geophysical DHEM conductors indicate the mineralisation likely continues down plunge. Red wireframe is the FWZ mineralisation envelope and gold wireframes are the upper high-grade copper-gold VMS zones. Red on drillholes are assays >0.5% copper.
Figure 4
Isometric view of the Ming Mineral Resource Model. All blocks above 1% CuEq shown. The Mineral Resource consists of a very high-grade VMS zone and core of 8.8Mt @ 3.9% CuEq M&I and 10.9Mt @ 3.8% CuEq Inferred. This is underlain by the broad FWZ stringer mineralisation.
Figure 5
2025-2026 drilling plan showing continued conversion of Inferred Mineral Resources (green) into the higher confidence Measured and Indicated Mineral Resources (yellow) ready for economic studies in 2026.
Figure 6
Key 2024-2025 milestones for the Green Bay Copper-Gold Project.
Figure 7
(Left) Location of the Green Bay copper-gold project in Newfoundland, Canada; (Right) FireFly’s mineral claims and simplified geology of the Baire Verte mineral district.
Figure 8
Green Bay Mineral Resource Grade-Tonnage sensitivity analysis by Mineral Resource category at various copper cut-off grades. Please refer to compliance statement in this announcement for parameters used to calculate the copper equivalent grade.
Figure 9
Green Bay Mineral Resource Estimate contained Copper equivalent metal sensitivity to the cut-off grade by Mineral Resource category.
Figure 10
Green Bay Mineral Resource contained copper sensitivity to the cut-off grade by Mineral Resource category.
Figure 11
Green Bay Mineral Resource contained gold sensitivity to cut-off grade by Mineral Resource category.
Figure 12
Long section of the Ming Deposit MRE extent and new drilling completed since the previous October 2024 MRE. The MRE remains open and geophysical DHEM conductors indicate the mineralisation likely continues down plunge. Red wireframe is the FWZ mineralisation envelope and gold wireframes are the upper high-grade copper-gold VMS zones. Red on drillholes are assays >0.5% copper.
Figure 13
Ming mineralisation model proposed by Pilote et al (2016).
Figure 14
Conceptual cross section of the Ming Deposit showing the upper high-grade copper and gold rich VMS mineralised lenses and the sub-seafloor higher-temperature footwall zone stringer style mineralisation.
Figure 15
Massive sulphide copper-gold rich mineralisation intersected in FireFly resource extension drilling (MUG24-030). The core photograph shown (48.75m to 55.8m) is part of a broader reported intersection of 13.1m @ 14.3% CuEq (10.7% Cu & 4.1g/t Au) true thickness. The mineralisation is predominantly pyrite and chalcopyrite with lesser local sphalerite. Refer to FireFly’s ASX announcement dated 19 June 2024.
Figure 16
Stringer-style FWZ mineralisation from the 735 Level in the Ming Mine (photograph taken in September 2024). The mineralisation consists of individual mm to cm scale chalcopyrite-pyrite veins hosted within highly chloritised rhyolite. This mineralisation is amenable to large-scale mining and often bulks out to grades exceeding 2% copper.
Figure 17
Core photographs for MUG25-202 showing the new very high grade core zone. This convergent zone consists of the upper VMS zone (827m-841.25m) that grades 14.3m @ 13.7% CuEq and the adjacent broad FWZ stringer-style mineralisation. This is part of the broader step-out intersection of 49.0m @ 6.1% CuEq that is the deepest hole drilled into the Ming Deposit to date.
Figure 18
Long section through the Ming Mine highlighting the current ~800m strike of the extremely high-grade core zone, which remains open. The FWZ stringer style mineralisation is developed directly beneath the upper high-grade VMS. Clipping +/- 30m.
Figure 19
Cross section through the Ming block model showing key geological and mineralisation domains. Red drillholes are grades >0.5% copper. Interpreted post-mineral mafic dykes are shown in green. Clipping +/-50m.
Figure 20
Long section showing the Mineral Resource Categories for the November 2025 MRE with all drillholes shown. This includes both historical drilling and all holes completed by FireFly since acquisition of the Project in October 2023.
© 2026 Canjex Publishing Ltd. All rights reserved.