Highlights
Robust Economics
- After-tax NPV5% of C$1,001 M and after-tax IRR of 26.6% at a base case gold price of US$3,600/oz and an exchange rate of 1.38 C$/US$.
- At a spot gold price of US$4,300/oz, after-tax NPV5% increases to C$1,565 M and after-tax IRR increases to 37.3%.
- After-tax payback of 4.3 years and NPV5% to initial capital ratio of 3.6x.
- Life-of-mine after-tax free cash flow of C$2,772 M over a 16.2-year mine life.
- Initial CAPEX of C$275.8 M and AISC of US$2,137/oz.
Production and Operating Profile
- Average annual gold production of 100koz over the life of mine.
- Total recovered gold production of 1,610koz.
- Metallurgical recovery of 95%, supported by the 2026 metallurgical testwork program and a conventional flowsheet with crushing, grinding, gravity concentration and cyanide leaching.
- Processing scenario: 3,000 tpd toll milling (year 1), 3,000 tpd on-site processing (years 2-4), 4,300 tpd on-site processing following expansion (year 5+).
- Mining scenario considers solely underground method of longitudinal longhole stoping with ramp extraction utilizing a peak mining rate of 4,300 tpd.
VAL-D'OR, Quebec, Sept. 17, 2026 (GLOBE NEWSWIRE) -- Cartier Resources Inc. (″Cartier″ or the ″Company″) (TSXV: ECR; FSE: 6CA; OTCQB: ECRFF) is pleased to announce the results of the updated Preliminary Economic Assessment (″PEA″) on its 100%-owned Cadillac Project, located in Val-d'Or (Abitibi, Quebec, Canada). The updated PEA was prepared in accordance with National Instrument 43-101 – Standards of Disclosure for Mineral Projects (″NI 43-101″) by Evomine Consulting Inc., and replaces the PEA published on April 13, 2023, on what was then named the Chimo Mine Project. It incorporates the updated mineral resource estimate announced on December 18, 2025, the metallurgical results announced on May 14, 2026, and a materially different gold price environment.
Philippe Cloutier, President and CEO of Cartier, stated: “The positive results of the study demonstrate the project's economic viability at the PEA level while highlighting several opportunities for further optimization. Importantly, the project has been designed as a fully underground mining operation, minimizing its surface footprint and supporting a responsible development approach. With low initial CAPEX requirements, we now have additional strategic solutions that offer flexibility to advance development. We remain confident in the project's strong potential and our ability to create additional value for stakeholders,”
Ronan Déroff, Vice President Exploration of Cartier, added: “The current PEA is only the beginning. With ~35,000 metres of drilling completed in 2025–2026 yet to be incorporated, and compelling new gold discoveries emerging at the Contact and Hope Sectors, we believe Cadillac offers substantial resource-growth potential and significant exploration upside along the 15-km Cadillac Fault — all of which remains outside the current economic model.”
Financial analysis
The economic analysis was performed using a 5% discount rate, a base case gold price of US$3,600/oz and an exchange rate of 1.38 C$/US$. On a pre-tax basis, the project generates an NPV5% of C$1,679 M, an IRR of 35.5% and a payback period of 3.0 years. On an after-tax basis, the project generates an NPV5% of C$1,001 M, an IRR of 26.6% and a payback period of 4.3 years. A summary of project economics is presented in Table 1.
Table 1: Summary of project economics
| Description | Unit | Value |
| Exchange rate | CA$/US$ | 1.38
|
| Gold price | US$/oz | 3,600
|
| Mineralized material mined | kt | 23,145
|
| Mineralized material grade | g/t | 2.28
|
| Mineralized material ounces | koz | 1,698
|
| Recovery | % | 95%
|
| Recovered gold | oz | 1,610
|
| Mine life | years | 16.2
|
| Discount rate | % | 5.0%
|
| Operating costs | | |
| Mining operating cost | CA$/t proc. | 95.1
|
| Processing operating cost | CA$/t proc. | 29.8
|
| Waste and water management operating cost | CA$/t proc. | 1.5
|
| General and administration operating cost | CA$/t proc. | 10.1
|
| Total operating costs | CA$/t proc. | 136.4
|
| AISC | | |
| Total operating costs | US$/oz | 1,450
|
| Selling costs | US$/oz | 5
|
| Royalty costs | US$/oz | 47
|
| Cash costs | US$/oz | 1,502
|
| Sustaining capital costs | US$/oz | 635
|
| All-In Sustaining Costs | US$/oz | 2,137
|
| Capital costs | | |
| Initial capital costs | CA$M | 275.8
|
| Growth capital costs | CA$M | 277.1
|
| Sustaining capital costs | CA$M | 1,062.0
|
| Closure capital costs | CA$M | 40.0
|
| Economics | | |
| Pre-tax Net Present Value | CA$M | 1,679.4
|
| Pre-tax Internal Rate of Return | % | 35.5%
|
| Pre-tax Payback Period | years | 3.0
|
| After-tax Net Present Value | CA$M | 1,001.2
|
| After-tax Internal Rate of Return | % | 26.6%
|
| After-tax Payback Period | years | 4.3
|
Table 2, Table 3, and Table 3 highlight the after-tax impact of performing a sensitivity analysis on gold price, capital costs and operating costs.
Table 2: Gold price sensitivity
| Gold Price (US$/Oz) | NPV (M CA$) | IRR (%) | Payback Period |
| 3,000 | 497.2 | 16.4%
| 6.2 |
| 3,600 (base case) | 1,001.2 | 26.6%
| 4.3 |
| 4,200 | 1,485.8 | 35.9%
| 2.8 |
| 4,800 | 1,961.7 | 44.9%
| 2.2 |
| 5,400 | 2,429.8 | 53.5%
| 1.9 |
| 6,000 | 2,896.0 | 62.0%
| 1.7 |
Table 3: Capital cost sensitivity
| Capital costs | NPV (M CA$) | IRR (%) |
Payback Period |
-20%
| 1,165 | 35.1%
| 2.8 |
-10%
| 1,083 | 30.5%
| 3.4 |
| Base Case | 1,001 | 26.6%
| 4.3 |
+10%
| 918 | 23.4%
| 4.7 |
+20%
| 833 | 20.5%
| 5.1 |
Table 4: Operating cost sensitivity
| Operating costs | NPV (M CA$) | IRR (%) |
Payback Period |
-20%
| 1,230 | 31.1%
| 3.4 |
-10%
| 1,116 | 28.9%
| 3.7 |
| Base Case | 1,001 | 26.6%
| 4.3 |
+10%
| 883 | 24.3%
| 4.5 |
+20%
| 762 | 21.8%
| 4.8 |
Capital and operating cost estimates
Initial capital is estimated at C$275.8 M, growth capital costs are estimated at C$277.1 M and sustaining capital at C$1,102.0 M, as detailed in Table 5. Total operating costs over the life-of-mine is estimated at C$3,148.2 M representing C$136.4/tonne processed, as detailed in Table 6.
Table 5: Capital cost summary
| Cost Area | Initial Capital Costs
(M CA$) | Growth Capital
Costs (M CA$) | Sustaining Capital
Costs (M CA$) | Total Capital Costs
(M CA$) |
| Infrastructure | 40.9 | - | 52.5 | 93.4 |
| Electrical and communication | 27.9 | - | 8.1 | 36.0 |
| Waste and water management | 9.2 | - | 58.7 | 68.0 |
| Mine - underground | 91.3 | - | 720.2 | 811.5 |
| Process plant | 9.0 | 230.2 | - | 239.2 |
| Indirect costs | 29.8 | 9.0 | 84.0 | 122.7 |
| Contingency | 37.9 | 37.8 | 138.5 | 214.2 |
| Capitalized revenue | -30.2 | - | - | -30.2 |
| Capitalized operating costs | 60.0 | - | - | 60.0 |
| Closure | - | - | 40.0 | 40.0 |
| Total | 275.8 | 277.1 | 1,102.0 | 1,654.9 |
Table 6: Operating cost summary
| Cost Area | Total (M CA$) | Unit cost (CA$/tonne processed) | Unit cost (US$/oz payable) |
| Underground mining | 2,193.7 | 95.1 | 1,010.3 |
| Mineralized material transportation | 15.1 | 0.7 | 6.9 |
| Processing | 672.3 | 29.1 | 309.6 |
| Waste and water management | 34.6 | 1.5 | 15.9 |
| General and administrative | 232.5 | 10.1 | 107.1 |
| Total | 3,148.2 | 136.4 | 1,449.9 |
Mine design and production schedule
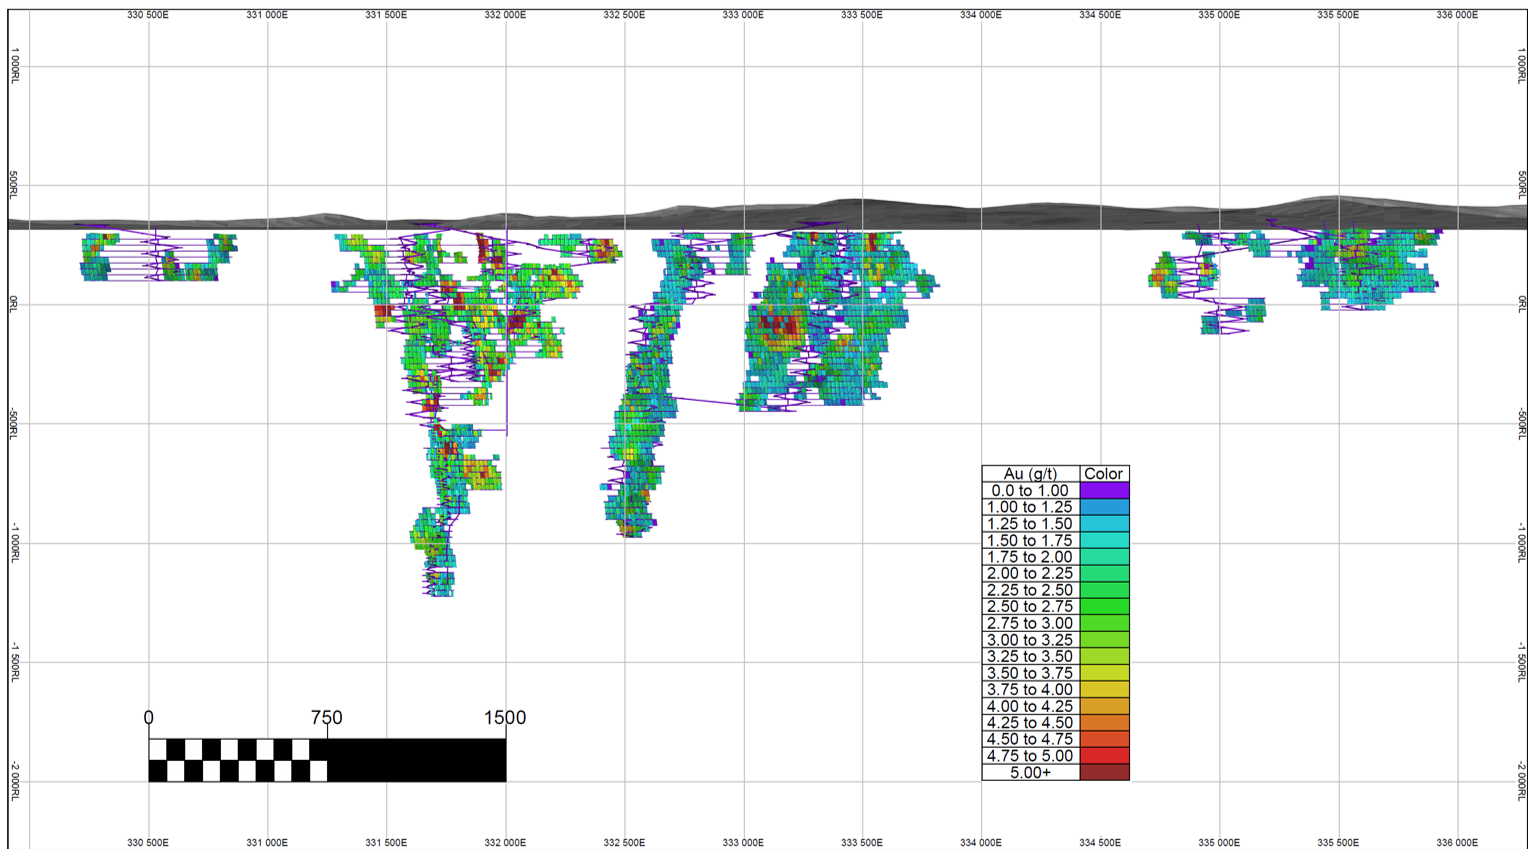
The PEA presents an underground mining operation that uses conventional longitudinal longhole stoping at a peak mining rate of 4,300 tpd over a 16.2-year mine life. A total of 23.1 Mt of mineralized material at an average grade of 2.3 g/t representing 1,698 koz of gold will be extracted. The mineralized material will be loaded by load-haul-dump (LHD) machines and hauled to the surface by trucks via ramps. For backfilling, a combination of pastefill, cemented rockfill and dry rockfill will be used. The mine will be split into five separate areas with each area having their dedicated mining infrastructure as illustrated in Figure 1.
Figure 1: Mine design
Metallurgy and processing
To complete the process plant design and determine metallurgical performance, a series of tests were performed on six variability samples: two from each of the three main zones, Chimo, East Chimo, and West Nordeau. The samples were selected from exploration drill core and are considered representative of the mineral resources. The test program included mineralogy, geochemistry, grindability, gold recovery, and tailings detoxification. The results indicate that, based on the average resource grade, a gold recovery of 95% could be achieved at a grind size P80 of 50 µm. The tests also established the required grinding energy, gold recovery equipment criteria, and reagent dosage design criteria.
The processing strategy considers toll milling to an off-site process plant for the pre-production period and the first year of production at a rate of 3,000 tpd. An on-site, 3,000 tpd process plant will become available to process material as of the second year of production and until the fourth year of production when it will be expanded to 4,300 tpd for the remainder of the life-of-mine. Figure 2 below shows the process flowsheet and identifies the additional equipment required for the expansion in red.
Figure 2: Process flowchart
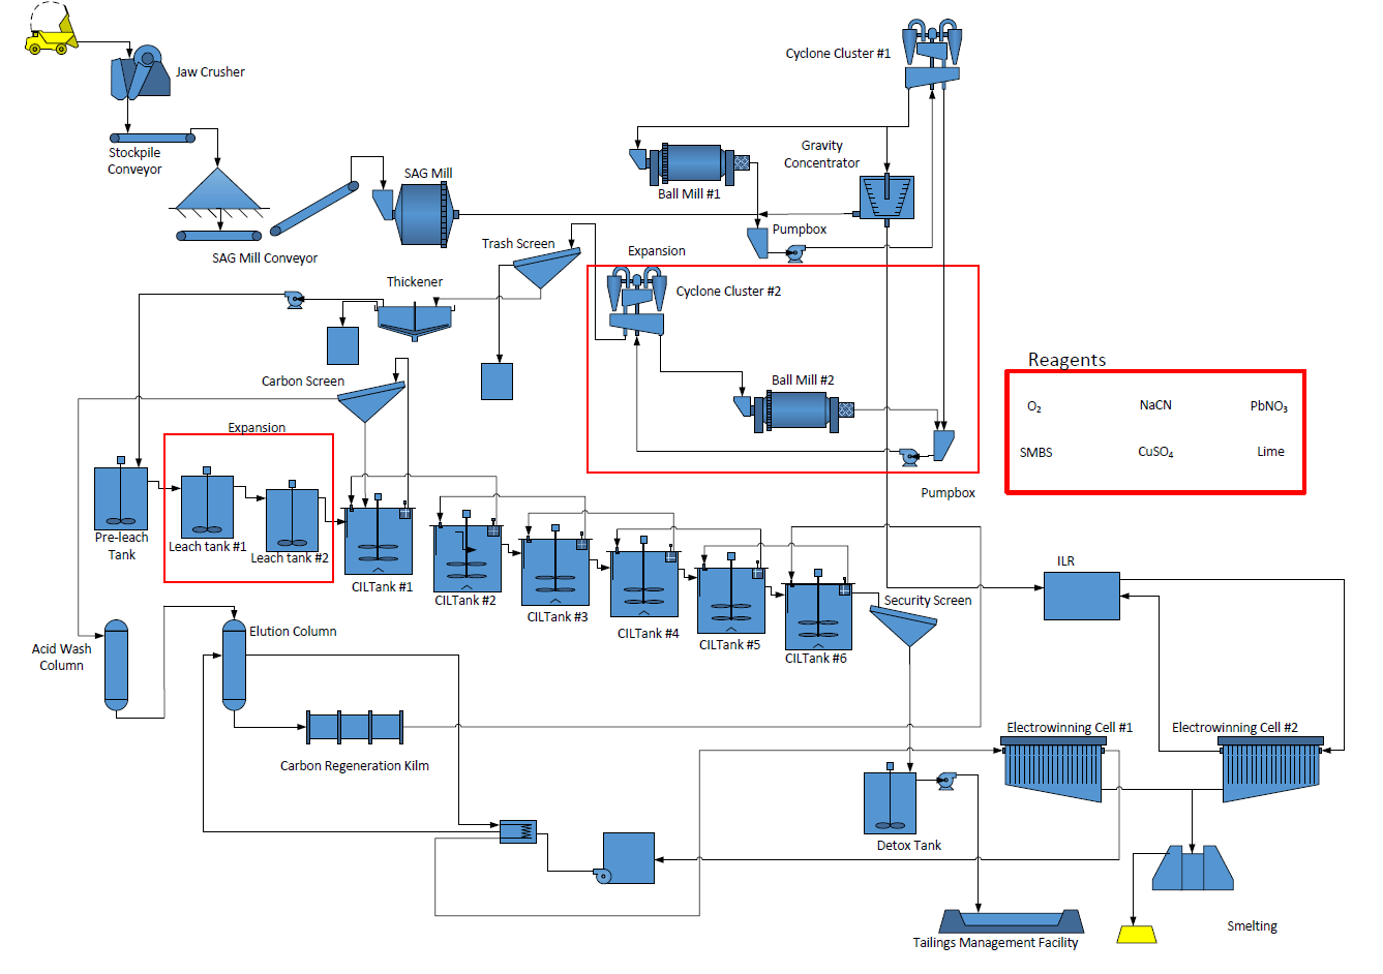
All Phase 1 equipment will be designed to handle the life-of-mine throughput, while the added equipment will provide the additional grinding power and cyanidation residence time required to complete gold dissolution.
Based on this flowsheet and feed throughput, the capital and operating costs of the gold extraction process plant were estimated to support the economic analysis. The plant was designed to achieve the projected 95% gold recovery in both phases.
Supporting infrastructure
Infrastructure requirements to support the project have been evaluated and the overall site layout has been developed to optimize operational efficiency, safety, and environmental management, while accounting for topography and minimizing the surface impact in the Project area. The required infrastructure for the project includes the following:
- Underground mine portals, lateral development and vertical development
- Waste rock and overburden management facilities
- Tailing management facility
- ROM stockpiles
- Water management infrastructure
- Electrical powerlines and substations
- Mine offices, dry and maintenance facility
- Other supporting infrastructure
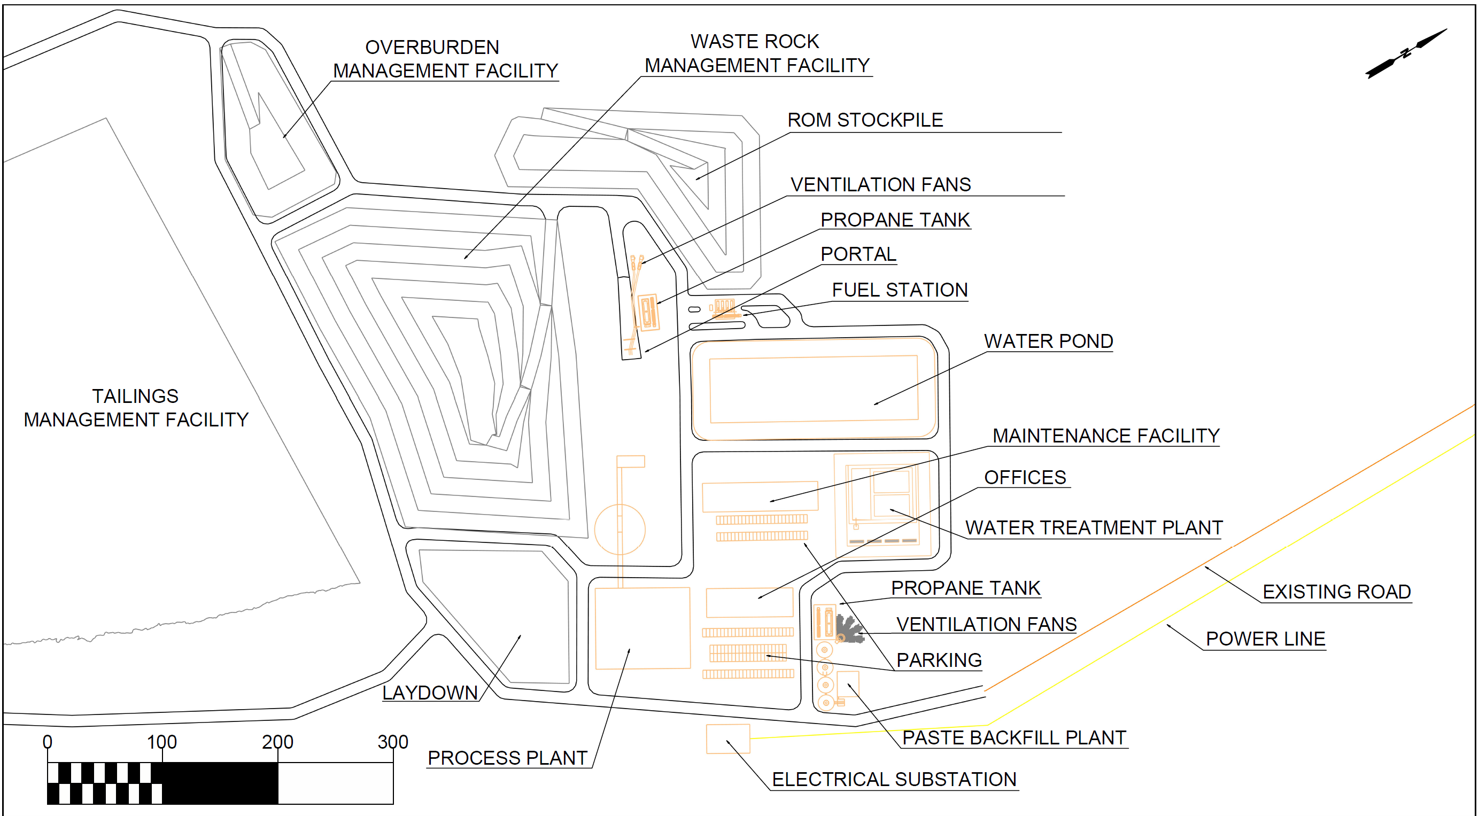
Figure 3 and Figure 4 illustrate the surface infrastructure general arrangement and the infrastructure on the main industrial pad for the project.
Figure 3: Surface infrastructure general arrangement
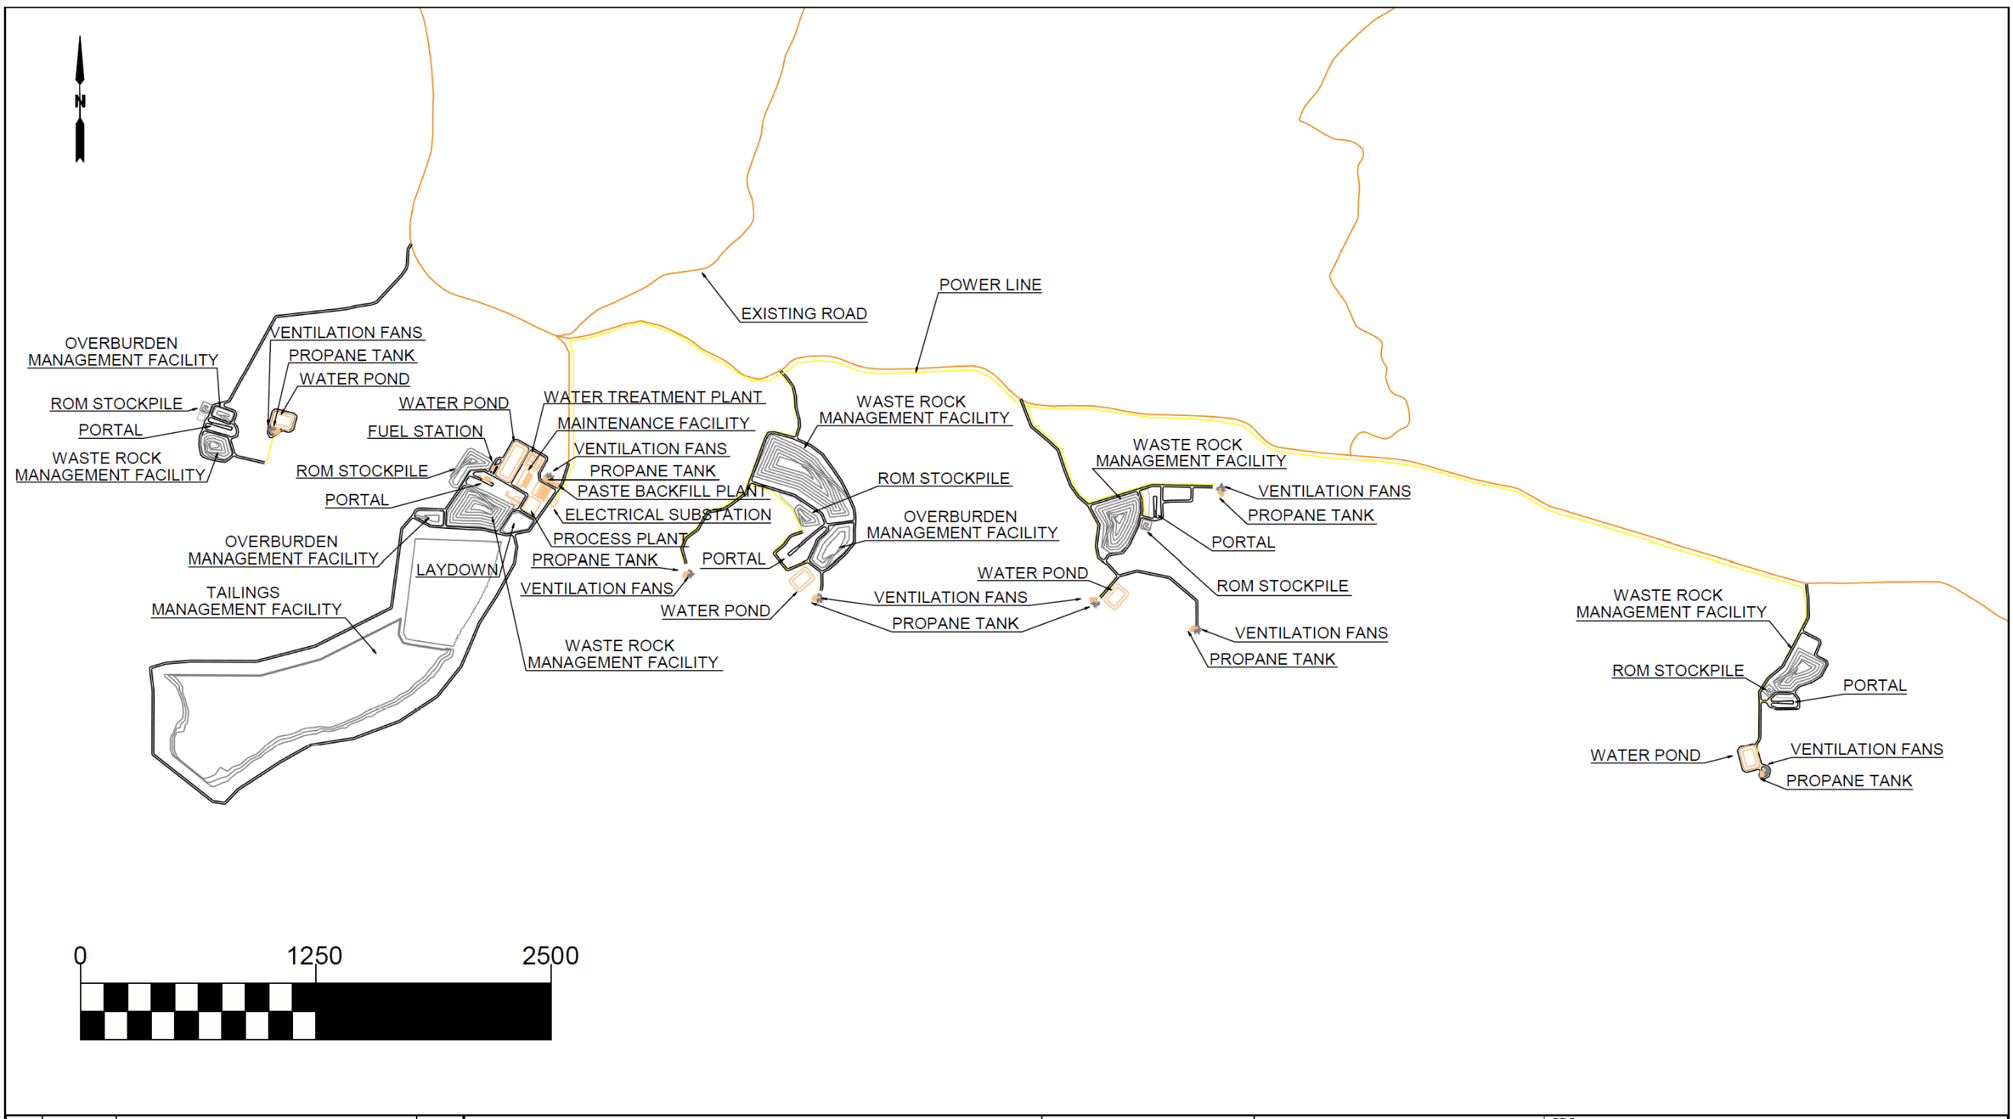
Figure 4: Main industrial pad infrastructure
Environmental, permitting and social considerations
The development of the Cadillac project continues under an approach focused on sustainable development, respect for stakeholders, and environmental protection. In 2026, Stantec completed a literature review of the project’s physical, biological, and social components in order to document and characterize the potential environmental issues associated with its footprint. The results of this review contributed to the selection and location of the infrastructure presented in the updated PEA, and will also be used to plan the next steps, including field inventories. In addition, an environmental geochemical characterization of the waste rock, ore, and tailings generated during processing was initiated in August 2026. This study is essential to the development of the Cadillac project, as it will help optimize the management of these materials and mining water management in order to limit impacts on the receiving environment. It will be conducted in accordance with the guidelines of Directive 019 and the Guide de caractérisation des résidus miniers et du minerai (GCRMM) issued by the Ministère de l’Environnement, de la Lutte contre les changements climatiques, de la Faune et des Parcs (MELCCFP).
Mineral Resource Estimate
The updated PEA is based on the mineral resource estimate announced on December 18, 2025, and detailed in the technical report filed on January 27, 2026 which is summarized in Table 7.
Table 7: Mineral Resource Estimate
All sectors /
Category
| Open Pit Resources | Underground Resources | Total |
| Cut-off Grade = 0.30g/t Au | Cut-off Grade = 1.00g/t Au |
| Tonnes (t) | Grade
(Au g/t) | Gold (oz) | Tonnes (t) | Grade
(Au g/t) | Gold (oz) | Tonnes (t) | Grade
(Au g/t) | Gold (oz) |
| Measured | 1,770,000 | 2.16 | 123,300 | 4,210,000 | 2.80 | 379,300 | 5,988,000 | 2.61 | 502,600 |
| Indicated | 1,730,000 | 1.52 | 84,500 | 2,240,000 | 2.51 | 180,600 | 3,965,000 | 2.08 | 265,200 |
Measured &
Indicated | 3,500,000 | 1.84 | 207,800 | 6,450,000 | 2.70 | 559,900 | 9,953,000 | 2.40 | 767,800 |
| Inferred | 4,740,000 | 1.13 | 172,600 | 30,450,000 | 2.29 | 2,244,200 | 35,185,000 | 2.14 | 2,416,900 |
- The independent qualified persons for the MRE, as defined by National Instrument (“NI”) 43-101 guidelines, is Pierre Luc Richard, P.Geo., of PLR Resources Inc., with contributions from Stephen Coates, P.Eng., of Evomine Consulting for cut-off grade estimation and open pit and underground stope optimization solids.
- These Mineral Resources are not mineral reserves as they have no demonstrated economic viability. No economic evaluation of these Mineral Resource has been produced. The quantity and grade of reported Inferred Resources in this MRE are uncertain in nature and there has been insufficient drilling to define these Inferred Resources as Indicated. However, it is reasonably expected that the majority of Inferred Mineral Resources could be upgraded to Indicated category with continued drilling.
- The Qualified Persons are not aware of any known environmental, permitting, legal, title-related, taxation, socio-political, marketing or other relevant issues that could materially affect the Mineral Resource Estimate.
- Calculations used metric units (metres, tonnes). Metal contents in the above table are presented in gram per tonne and troy ounces. Metric tonnages and ounces were rounded, and any discrepancies in total amounts are due to rounding errors.
- CIM definitions and guidelines for Mineral Resource Estimates have been followed.
Notes Accompanying the Mineral Resource Estimate
- Resources are presented as undiluted and in situ for the open-pit scenario within 5m x 5m x 5m blocks and include internal dilution for the underground scenario and are considered to have reasonable prospects for economic extraction. The constraining pit shell was developed using overall pit slopes of 50 degrees. The pit optimization to develop the mineral resource-constraining pit shells was done using the pseudoflow algorithm in Deswik software. The stope optimization to develop the underground mineral resource was done using Deswik.SO software.
- The MRE wireframe was prepared using Leapfrog Edge v.2025.1.1 and is based on 4,477 drill holes, totalling 535,360 meters drilled and 167,978 assays. The cut-off date for the drill hole database was February 17, 2025.
- Composites of 1.0 metre were created inside the mineralization domains. High-grade capping was done on the composited assay data. Based on individual statistical study for each zone, composites were capped between 5.0 g/t Au and 110.0 g/t Au for the high-grade zones, and between 1.0 g/t Au and 5.0 g/t Au for the low-grade zones.
- Pit constrained Mineral Resources for the base case are reported at a cut-off grade of 0.30 g/t Au; DSO-constrained Mineral Resources for the base case are reported at a cut-off grade of 1.00 g/t Au and include internal dilution (must-take). The cut-off grades will be re-evaluated in light of future prevailing market conditions and costs.
- Specific gravity values were estimated using data available in the drill hole database. Density values between 2.80 and 2.88 were applied to the model for hard rock and 2.00 for overburden.
- Grade model resource estimation was calculated from drill hole data using an Ordinary Kriging interpolation method in a sub-blocked model using blocks measuring 5 m x 5 m x 5 m in size and sub-blocks down to 0.625m x 0.625m x 0.625m. Ordinary kriging (OK), inverse square distance (ID2), Nearest neighbour (NN) interpolation methods were tested, resulting in no material difference in the Mineral Resource Estimates.
- The Measured, Indicated and Inferred Mineral Resource categories are constrained to areas where drill spacing is less than 12.5m, 25m and 100 metres respectively and show reasonable geological and grade continuity. An additional requirement for the Measured category is the close proximity of underground infrastructure. Cookie cutters were used to define categories based on the above parameters. Based on historical mining and geological knowledge of the deposit, drill spacing was increased up to 140m in the shoot direction to define inferred resources for some zones.
Independence and Responsibilities
The updated PEA was prepared by independent consulting firms with the respective responsibilities set out in Table 8.
Table 8: Consulting Firms and Areas of Responsibility
| Consulting firm | Area of responsibility |
Evomine Consulting Inc.
Lead consultant and integrator | - Study management and integration
- Mine design and production schedule
- Supporting infrastructure
- Capital and operating cost estimates
- Financial analysis
|
| Geodoz Conseil Inc. | - Environmental, permitting and social considerations
- Closure cost estimates
|
| PLR Resources Inc. | - Mineral resource estimate
|
| Soutex Inc. | - Metallurgy and processing
- Process capital and operating cost estimates
|
Qualified Person
The PEA was prepared by consultants who are independent of Cartier, each of whom are Qualified Persons (″QP″) as defined by NI 43-101 as defined by National Instrument 43-101 – Standards of Disclosure for Mineral Projects (″NI 43-101″). Each of the QPs have reviewed and confirmed that this news release fairly and accurately reflects, in the form and context in which it appears, the information contained in the respective sections of the PEA for which they are responsible. The following acted as QPs under NI 43-101 in the context of the PEA:
- Alexandre Burelle, P.Eng. of Evomine Consulting Inc. responsible for Mining Methods, Project Infrastructure, Economic Analysis, and inputs for Capital and Operating Costs.
- Stephen Coates, P.Eng. of Evomine Consulting Inc. responsible for Introduction, Reliance on Other Experts, Market Studies and Contracts, and Other Relevant Data and Information.
- Maude Lévesque Michaud, P.Eng, M.Sc.A. of Geodoz Conseil Inc. responsible for Environmental Studies, Permitting and Social or Community Impact and inputs for Capital and Operating Costs.
- Pierre-Luc Richard, P.Geo. of PLR Resources Inc. responsible for Property Description and Location, Accessibility, Climate, Local Resources, Infrastructure and Physiography, History, Geological Setting and Mineralization, Deposit Types, Exploration, Drilling, Sample Preparation, Analyses and Security, Data Verification, Mineral Resource Estimates, and Adjacent Properties.
- Pierre Roy, P.Eng., M.Sc., of Soutex Inc. responsible for Mineral Processing, and Metallurgical Testing, Recovery Methods and inputs for Capital and Operating Costs.
- The scientific and technical content of this press release has been reviewed and approved by Mr. Ronan Déroff, P.Geo., M.Sc., Vice President Exploration of Cartier, who is a QP under NI 43-101.
Technical Report Filing
A technical report prepared in accordance with NI 43-101 in support of the updated PEA will be filed on SEDAR+ at www.sedarplus.ca and on the Company's website within 45 days of the date of this news release.
About Cadillac Project
The Cadillac Project, covering 14,000 hectares along a 15-kilometre stretch of the Cadillac Fault, is one of the largest consolidated land packages in the Val-d'Or mining camp. Cartier's flagship asset integrates the historic Chimo Mine and East Cadillac projects, creating a dominant position in a world-class gold mining district. With excellent road access, year-round infrastructure and nearby milling capacity, the project is well positioned for rapid advancement and value creation. The Cadillac property contains total gold resources of 767,800 ounces in the measured and indicated category (10.0 Mt at 2.4 g/t Au) and 2,416,900 ounces in the inferred category (35.2 Mt at 2.1 g/t Au) across all sectors. An updated PEA for the Cadillac Project demonstrated an after-tax NPV5% of C$1,001 M and IRR of 26.6% at US$3,600/oz Gold.
About Cartier Resources Inc.
Cartier Resources Inc., founded in 2006 and headquartered in Val-d’Or (Quebec) is a gold exploration company focused on building shareholder value through discovery and development in one of Canada’s most prolific mining camps. The Company combines strong technical expertise, a track record of successful exploration, and a fully funded program to advance its flagship Cadillac Project. Cartier’s strategy is clear: unlock the full potential of one of the largest undeveloped gold landholdings in Quebec.
Non-IFRS Financial Measures
This news release includes certain performance measures commonly used in the mining industry that are not defined under IFRS. These measures have no standardized meaning under IFRS and may not be comparable to similar measures used by other companies. They are provided for additional information only and should not be considered in isolation or as a substitute for IFRS measures. As the project is at the PEA stage and not in production, no historical reconciliations to IFRS measures are available.
Forward-Looking Statements
This news release contains ″forward-looking information″ and ″forward-looking statements″ within the meaning of applicable Canadian securities legislation. Forward-looking statements include, but are not limited to, statements regarding the results and assumptions of the updated PEA, projected production, capital and operating costs, net present value, internal rate of return and payback period, the timing and filing of the technical report, the timing and results of future exploration, resource conversion, permitting and development activities, and the Company's plans and objectives. Forward-looking statements are based on assumptions that management considers reasonable, including assumptions as to gold prices, exchange rates, metallurgical recoveries, the availability of third-party milling capacity, capital and operating cost estimates, the accuracy of mineral resource estimates, the ability to obtain required permits and financing, and the absence of material adverse changes in the economic and regulatory environment. Actual results may differ materially. The PEA is preliminary in nature and includes Inferred Mineral Resources that are considered too speculative geologically to have the economic considerations applied to them that would enable them to be categorized as Mineral Reserves, and there is no certainty that the results of the PEA will be realized. Risks and uncertainties include, but are not limited to, fluctuations in the price of gold and in exchange rates, the inability to convert mineral resources into mineral reserves, the preliminary nature of metallurgical results, variations in capital and operating costs from estimates, delays in obtaining permits or third-party agreements, changes in the availability and cost of financing, the duty to consult and accommodate First Nations, and the other risk factors described in the Company's continuous disclosure documents filed on SEDAR+ at www.sedarplus.ca. Readers should not place undue reliance on forward-looking statements, which speak only as of the date of this news release. The Company disclaims any obligation to update forward-looking information except as required by law.
For further information, contact:
Philippe Cloutier, P. Geo.
President and CEO
Telephone: 819-856-0512
philippe.cloutier@ressourcescartier.com
www.ressourcescartier.com
Neither TSX Venture Exchange nor its Regulation Services Provider (as that term is defined in policies of the TSX Venture Exchange) accepts responsibility for the adequacy or accuracy of this release.
Photos accompanying this announcement are available at
https://www.globenewswire.com/NewsRoom/AttachmentNg/58418ab4-a237-4a57-8ca4-84bdb8b464b3
https://www.globenewswire.com/NewsRoom/AttachmentNg/0bfe1fa0-9202-4095-b09c-a7da75c365eb
https://www.globenewswire.com/NewsRoom/AttachmentNg/53b5cc9e-07f7-41ea-826a-2b115be72327
https://www.globenewswire.com/NewsRoom/AttachmentNg/a2f7db64-bd52-47f8-a45e-fa4b1e68a673



Figure 1:
Mine design
Figure 2:
Process flowchart
Figure 3:
Surface infrastructure general arrangement
Figure 4:
Main industrial pad infrastructure
© 2026 Canjex Publishing Ltd. All rights reserved.