Announced Definitive Merger Agreement with UWM Holdings Corporation (UWMC)

Company Website:
https://twoinv.com
NEW YORK -- (Business Wire)
TWO (Two Harbors Investment Corp., NYSE: TWO), an MSR-focused real estate investment trust (REIT), today announced its financial results for the quarter ended December 31, 2025.
This press release features multimedia. View the full release here: https://www.businesswire.com/news/home/20260202237666/en/
TWO Fourth Quarter 2025 Financial Results Summary
Quarterly Summary
-
Entered into a definitive merger agreement with UWMC pursuant to which UWMC will acquire TWO in an all-stock transaction.
-
TWO stockholders will receive a fixed exchange ratio of 2.3328 shares of UWMC Class A Common Stock for each share of TWO common stock. This represents an $11.94 per share value based on UWMC’s closing price as of December 16, 2025, and a premium of 21% the volume weighted average price of TWO’s common stock for the 30 days ending December 16, 2025.
-
The all-stock transaction is intended to be tax-free to TWO’s stockholders.
-
Prior to the closing of the merger, TWO intends to pay regular quarterly dividends in the ordinary course consistent with past practice for all completed quarterly periods. TWO does not intend to pay a partial dividend for the quarter in which the closing occurs in the event the closing does not occur as of quarter-end.
-
TWO preferred stock will be converted into equivalent shares of UWMC preferred stock.
-
The transaction is expected to close in the second quarter of 2026, subject to approval of TWO’s stockholders and the satisfaction of other closing conditions, including customary regulatory approvals.
-
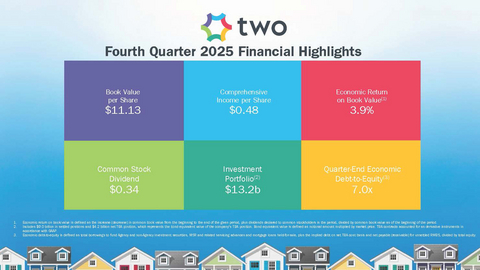
Reported book value of $11.13 per common share, and declared a fourth quarter common stock dividend of $0.34 per share, representing a 3.9% quarterly economic return on book value.(1)
-
Generated comprehensive income of $50.4 million, or $0.48 per weighted average basic common share.
-
Added $399.1 million in unpaid principal balance (UPB) of MSR through flow-sale acquisitions and recapture, and sold $9.6 billion MSR UPB on a subservicing-retained basis.
-
As of December 31, 2025, MSR portfolio had a weighted average gross coupon rate of 3.55% and a 60+ day delinquency rate of 0.87%, and had experienced a 3-month CPR of 6.4%.
-
Funded $93.8 million UPB in loans and brokered an additional $58.5 million UPB in second lien loans.
Annual Summary
-
Declared dividends of $1.52 per common share.
-
Generated a (12.6)% economic return on book value.(1)
-
Excluding the $375 million settlement expense to resolve litigation with the company’s former external manager, generated a 12.1% economic return on book value.(1)
-
Total stockholder return of 2.8%.(2)
-
Added $7.9 billion in UPB of MSR through bulk and flow-sale acquisitions and recapture, and sold $28.7 billion MSR UPB on a subservicing-retained basis.
-
Funded $221.1 million UPB in loans and brokered an additional $198.7 million UPB in second lien loans.
Post Quarter-End Update
-
Convertible senior notes of $261.9 million in UPB were repaid in full on their January 15, 2026 maturity date.
________________________
|
(1)
|
Economic return on book value is defined as the increase (decrease) in common book value from the beginning to the end of the given period, plus dividends declared to common stockholders in the period, divided by common book value as of the beginning of the period.
|
(2)
|
Total stockholder return is calculated for the period December 31, 2024 through December 31, 2025. Total stockholder return is defined as stock price appreciation including reinvestment of dividends. Source: Bloomberg.
|
“The acquisition of TWO by UWMC joins us with the country’s number one mortgage originator and doubles the size of the MSR portfolio to a pro-forma $400 billion,” said Bill Greenberg, TWO’s President and Chief Executive Officer. “This transaction creates, I believe, a very powerful strategic alignment of two high-quality organizations, and positions the combined company for accelerated growth and meaningful upside for shareholders. ”
“Our portfolio performed well in the fourth quarter, as RMBS returns benefited from lower realized and implied volatility as well the re-emergence of the GSE’s as a source of demand. Our MSR portfolio performed as it was designed to do and earned its carry,” stated Nick Letica, TWO’s Chief Investment Officer. “With the significant mortgage spread tightening realized in the fourth quarter and continuing into this quarter, spreads and volatility are back to pre-COVID levels, which makes the risk of owning RMBS more two-sided going forward and highlights the benefits of owning a portfolio of hedged MSR which is less sensitive to those spread movements.”
Operating Performance
The following table summarizes the company’s GAAP and non-GAAP earnings measurements and key metrics for the fourth quarter of 2025 and third quarter of 2025:
Operating Performance (unaudited) |
(dollars in thousands, except per common share data)
|
|
| Three Months Ended December 31, 2025 |
| Three Months Ended September 30, 2025 |
Earnings Attributable to Common Stockholders |
| Earnings |
| Per weighted average basic common share |
| Annualized return on average common equity |
| Earnings |
| Per weighted average basic common share |
| Annualized return on average common equity |
Comprehensive Income (Loss)
|
|
$
|
50,429
|
|
|
$
|
0.48
|
|
|
17.2
|
%
|
|
$
|
(80,207
|
)
|
|
$
|
(0.77
|
)
|
|
(26.5
|
)%
|
GAAP Net Loss
|
|
$
|
(1,325
|
)
|
|
$
|
(0.02
|
)
|
|
(0.5
|
)%
|
|
$
|
(141,245
|
)
|
|
$
|
(1.36
|
)
|
|
(46.6
|
)%
|
Earnings Available for Distribution(1) |
|
$
|
27,435
|
|
|
$
|
0.26
|
|
|
9.4
|
%
|
|
$
|
37,154
|
|
|
$
|
0.36
|
|
|
12.3
|
%
|
|
|
|
|
|
|
|
|
|
|
|
|
|
Operating Metrics |
|
|
|
|
|
|
|
|
|
|
|
|
Dividend per common share
|
|
$
|
0.34
|
|
|
|
|
|
|
$
|
0.34
|
|
|
|
|
|
Annualized dividend yield(2) |
|
|
13.0
|
%
|
|
|
|
|
|
|
13.8
|
%
|
|
|
|
|
Book value per common share at period end
|
|
$
|
11.13
|
|
|
|
|
|
|
$
|
11.04
|
|
|
|
|
|
Economic return on book value(3) |
|
|
3.9
|
%
|
|
|
|
|
|
|
(6.3
|
)%
|
|
|
|
|
Operating expenses, excluding non-cash LTIP amortization and certain operating expenses(4) |
|
$
|
43,699
|
|
|
|
|
|
|
$
|
38,748
|
|
|
|
|
|
Operating expenses, excluding non-cash LTIP amortization and certain operating expenses, as a percentage of average equity(4) |
|
|
9.7
|
%
|
|
|
|
|
|
|
8.5
|
%
|
|
|
|
|
________________________
|
(1)
|
Earnings Available for Distribution, or EAD, is a non-GAAP measure. Please see page 13 for a definition of EAD and a reconciliation of GAAP to non-GAAP financial information.
|
(2)
|
Dividend yield is calculated based on annualizing the dividends declared in the given period, divided by the closing share price as of the end of the period.
|
(3)
|
Economic return on book value is defined as the increase (decrease) in common book value from the beginning to the end of the given period, plus dividends declared to common stockholders in the period, divided by the common book value as of the beginning of the period.
|
(4)
|
Excludes non-cash equity compensation expense of $3.4 million for the fourth quarter of 2025 and $1.5 million for the third quarter of 2025 and certain operating expenses of $4.2 million for the fourth quarter of 2025 and $4.1 million for the third quarter of 2025. Certain operating expenses predominantly consists of transaction expenses incurred in connection with the company’s proposed merger with UWMC and the company’s litigation with its former external manager.
|
Portfolio Summary
As of December 31, 2025, the company’s portfolio was comprised of $9.0 billion of Agency RMBS, MSR and other investment securities as well as their associated notional debt hedges. Additionally, the company held $4.2 billion bond equivalent value of net long to-be-announced securities (TBAs).
The following tables summarize the company’s investment portfolio as of December 31, 2025 and September 30, 2025:
Investment Portfolio Composition |
| As of December 31, 2025 |
| As of September 30, 2025 |
(dollars in thousands)
|
|
(unaudited)
|
|
(unaudited)
|
Agency RMBS
|
|
$
|
6,579,141
|
|
73.1
|
%
|
|
$
|
6,477,694
|
|
71.1
|
%
|
Mortgage servicing rights(1) |
|
|
2,421,910
|
|
26.9
|
%
|
|
|
2,626,706
|
|
28.9
|
%
|
Other
|
|
|
3,259
|
|
—
|
%
|
|
|
3,284
|
|
—
|
%
|
Aggregate Portfolio
|
|
|
9,004,310
|
|
|
|
|
9,107,684
|
|
|
Net TBA position(2) |
|
|
4,199,576
|
|
|
|
|
4,384,749
|
|
|
Total Portfolio
|
|
$
|
13,203,886
|
|
|
|
$
|
13,492,433
|
|
|
________________________
|
(1)
|
Based on the prior month-end’s principal balance of the loans underlying the company’s MSR, increased for current month purchases.
|
(2)
|
Represents bond equivalent value of TBA position. Bond equivalent value is defined as notional amount multiplied by market price. Accounted for as derivative instruments in accordance with GAAP.
|
| Portfolio Metrics Specific to Agency RMBS |
| As of December 31, 2025 |
| As of September 30, 2025 |
|
|
(unaudited)
|
|
(unaudited)
|
Weighted average cost basis(1) |
|
$
|
101.61
|
|
|
$
|
101.68
|
|
Weighted average experienced three-month CPR
|
|
|
7.9
|
%
|
|
|
8.0
|
%
|
Gross weighted average coupon rate
|
|
|
6.1
|
%
|
|
|
6.1
|
%
|
Weighted average loan age (months)
|
|
|
26
|
|
|
|
28
|
|
________________________
|
(1)
|
Weighted average cost basis includes Agency principal and interest RMBS only and utilizes carrying value for weighting purposes.
|
| Portfolio Metrics Specific to MSR(1) |
| As of December 31, 2025 |
| As of September 30, 2025 |
(dollars in thousands)
|
|
(unaudited)
|
|
(unaudited)
|
Unpaid principal balance
|
|
$
|
162,450,487
|
|
|
$
|
175,820,641
|
|
Gross coupon rate
|
|
|
3.6
|
%
|
|
|
3.6
|
%
|
Current loan size
|
|
$
|
324
|
|
|
$
|
328
|
|
Original FICO(2) |
|
|
760
|
|
|
|
759
|
|
Original LTV
|
|
|
73
|
%
|
|
|
73
|
%
|
60+ day delinquencies
|
|
|
0.9
|
%
|
|
|
0.9
|
%
|
Net servicing fee
|
|
25.3 basis points
|
|
25.4 basis points
|
|
|
|
|
|
|
| Three Months Ended December 31, 2025 |
| Three Months Ended September 30, 2025 |
|
|
(unaudited)
|
|
(unaudited)
|
Fair value losses
|
|
$
|
(65,213
|
)
|
|
$
|
(104,896
|
)
|
Servicing income
|
|
$
|
133,160
|
|
|
$
|
155,713
|
|
Servicing costs
|
|
$
|
3,705
|
|
|
$
|
4,270
|
|
Change in servicing reserves
|
|
$
|
(322
|
)
|
|
$
|
(508
|
)
|
________________________
|
(1)
|
Metrics exclude residential mortgage loans in securitization trusts for which the company is the named servicing administrator. Portfolio metrics, other than UPB, represent averages weighted by UPB.
|
(2)
|
FICO represents a mortgage industry accepted credit score of a borrower.
|
|
| As of December 31, 2025 |
| As of September 30, 2025 |
Serviced Mortgage Assets |
| Number of Loans |
| Unpaid Principal Balance |
| Number of Loans |
| Unpaid Principal Balance |
(dollars in thousands)
|
|
(unaudited)
|
|
(unaudited)
|
Mortgage servicing rights....................................................................................................
|
|
675,215
|
|
$
|
162,450,487
|
|
720,038
|
|
$
|
175,820,641
|
Subservicing(1)................................................................................................
|
|
178,356
|
|
|
40,492,124
|
|
135,706
|
|
|
30,203,608
|
Servicing administrator(2)............................................................................................
|
|
514
|
|
|
272,820
|
|
519
|
|
|
278,371
|
Mortgage loans held-for-sale(3)....................................................................................................
|
|
38
|
|
|
13,336
|
|
41
|
|
|
12,300
|
Total serviced mortgage assets.................................................................................................
|
|
854,123
|
|
$
|
203,228,767
|
|
856,304
|
|
$
|
206,314,920
|
________________________
|
(1)
|
Off-balance sheet mortgage loans owned by third parties and subserviced by the company.
|
(2)
|
Off-balance sheet mortgage loans owned by third parties for which the company acts as servicing administrator (subserviced by appropriately licensed third-party subservicers).
|
(3)
|
Originated or purchased mortgage loans held-for-sale at period-end.
|
Other Investments and Risk Management Metrics |
| As of December 31, 2025 |
| As of September 30, 2025 |
(dollars in thousands)
|
|
(unaudited)
|
|
(unaudited)
|
Net long TBA notional(1) |
|
$
|
4,206,715
|
|
|
$
|
4,407,629
|
|
Futures notional
|
|
$
|
(4,357,800
|
)
|
|
$
|
(5,048,200
|
)
|
Interest rate swaps notional
|
|
$
|
12,579,986
|
|
|
$
|
24,881,904
|
|
________________________
|
(1)
|
Accounted for as derivative instruments in accordance with GAAP.
|
Financing Summary
The following tables summarize the company’s secured and unsecured financing arrangements and related metrics as of December 31, 2025 and September 30, 2025:
December 31, 2025 |
| Balance |
| Weighted Average Borrowing Rate |
| Weighted Average Months to Maturity |
| Number of Distinct Counterparties |
(dollars in thousands, unaudited)
|
|
|
|
|
|
|
|
|
Repurchase agreements collateralized by securities
|
|
$
|
6,601,446
|
|
4.13
|
%
|
|
1.78
|
|
16
|
Repurchase agreements collateralized by MSR
|
|
|
650,000
|
|
6.76
|
%
|
|
6.34
|
|
3
|
Repurchase agreements collateralized by mortgage loans
|
|
|
4,094
|
|
5.88
|
%
|
|
2.72
|
|
1
|
Total repurchase agreements
|
|
|
7,255,540
|
|
4.36
|
%
|
|
2.19
|
|
18
|
Revolving credit facilities collateralized by MSR and related servicing advance obligations
|
|
|
919,371
|
|
6.77
|
%
|
|
21.30
|
|
3
|
Warehouse lines of credit collateralized by mortgage loans
|
|
|
9,406
|
|
6.00
|
%
|
|
2.63
|
|
1
|
Unsecured senior notes
|
|
|
111,055
|
|
9.38
|
%
|
|
55.50
|
|
n/a
|
Unsecured convertible senior notes
|
|
|
261,810
|
|
6.25
|
%
|
|
0.49
|
|
n/a
|
Total borrowings
|
|
$
|
8,557,182
|
|
|
|
|
|
|
September 30, 2025 |
| Balance |
| Weighted Average Borrowing Rate |
| Weighted Average Months to Maturity |
| Number of Distinct Counterparties |
(dollars in thousands, unaudited)
|
|
|
|
|
|
|
|
|
Repurchase agreements collateralized by securities
|
|
$
|
6,363,146
|
|
4.29
|
%
|
|
2.90
|
|
16
|
Repurchase agreements collateralized by MSR
|
|
|
738,000
|
|
7.35
|
%
|
|
9.40
|
|
3
|
Repurchase agreements collateralized by mortgage loans
|
|
|
3,504
|
|
6.28
|
%
|
|
2.83
|
|
1
|
Total repurchase agreements
|
|
|
7,104,650
|
|
4.61
|
%
|
|
3.58
|
|
18
|
Revolving credit facilities collateralized by MSR and related servicing advance obligations
|
|
|
945,371
|
|
7.23
|
%
|
|
17.03
|
|
3
|
Warehouse lines of credit collateralized by mortgage loans
|
|
|
8,452
|
|
6.38
|
%
|
|
2.70
|
|
1
|
Unsecured senior notes
|
|
|
110,866
|
|
9.38
|
%
|
|
58.52
|
|
n/a
|
Unsecured convertible senior notes
|
|
|
261,370
|
|
6.25
|
%
|
|
3.52
|
|
n/a
|
Total borrowings
|
|
$
|
8,430,709
|
|
|
|
|
|
|
Borrowings by Collateral Type |
| As of December 31, 2025 |
| As of September 30, 2025 |
(dollars in thousands)
|
|
(unaudited)
|
|
(unaudited)
|
Agency RMBS
|
|
$
|
6,601,446
|
|
|
$
|
6,363,146
|
|
Mortgage servicing rights and related servicing advance obligations
|
|
|
1,569,371
|
|
|
|
1,683,371
|
|
Other - secured
|
|
|
13,500
|
|
|
|
11,956
|
|
Other - unsecured(1) |
|
|
372,865
|
|
|
|
372,236
|
|
Total
|
|
|
8,557,182
|
|
|
|
8,430,709
|
|
TBA cost basis
|
|
|
4,185,465
|
|
|
|
4,391,419
|
|
Net payable (receivable) for unsettled RMBS
|
|
|
(177,891
|
)
|
|
|
(133,405
|
)
|
Total, including TBAs and net payable (receivable) for unsettled RMBS
|
|
$
|
12,564,756
|
|
|
$
|
12,688,723
|
|
Debt-to-equity ratio at period-end(2) |
|
4.8 :1.0
|
|
4.8 :1.0
|
Economic debt-to-equity ratio at period-end(3) |
|
7.0 :1.0
|
|
7.2 :1.0
|
|
|
|
|
|
Cost of Financing by Collateral Type(4) |
| Three Months Ended December 31, 2025 |
| Three Months Ended September 30, 2025 |
|
|
(unaudited)
|
|
(unaudited)
|
Agency RMBS
|
|
|
4.27
|
%
|
|
|
4.55
|
%
|
Mortgage servicing rights and related servicing advance obligations(5) |
|
|
7.63
|
%
|
|
|
7.90
|
%
|
Other - secured
|
|
|
6.60
|
%
|
|
|
6.91
|
%
|
Other - unsecured(1)(5) |
|
|
7.96
|
%
|
|
|
7.96
|
%
|
Annualized cost of financing
|
|
|
5.04
|
%
|
|
|
5.38
|
%
|
Interest rate swaps(6) |
|
|
(0.13
|
)%
|
|
|
(0.24
|
)%
|
U.S. Treasury futures(7) |
|
|
(0.14
|
)%
|
|
|
(0.15
|
)%
|
TBAs(8) |
|
|
4.00
|
%
|
|
|
4.25
|
%
|
Total annualized cost of financing(8) |
|
|
4.41
|
%
|
|
|
4.59
|
%
|
________________________
|
(1)
|
Unsecured borrowings under senior notes and convertible senior notes.
|
(2)
|
Defined as total borrowings to fund Agency and non-Agency investment securities, MSR and related servicing advances and mortgage loans held-for-sale, divided by total equity.
|
(3)
|
Defined as total borrowings to fund Agency and non-Agency investment securities, MSR and related servicing advances and mortgage loans held-for-sale, plus the implied debt on net TBA cost basis and net payable (receivable) for unsettled RMBS, divided by total equity.
|
(4)
|
Excludes any repurchase agreements collateralized by U.S. Treasuries.
|
(5)
|
Includes amortization of debt issuance costs.
|
(6)
|
The cost of financing on interest rate swaps held to mitigate interest rate risk associated with the company’s outstanding borrowings includes interest spread income/expense and amortization of upfront payments made or received upon entering into interest rate swap agreements and is calculated using average borrowings balance as the denominator.
|
(7)
|
The cost of financing on U.S. Treasury futures held to mitigate interest rate risk associated with the company’s outstanding borrowings is calculated using average borrowings balance as the denominator. U.S. Treasury futures income is the economic equivalent to holding and financing a relevant cheapest-to-deliver U.S. Treasury note or bond using short-term repurchase agreements.
|
(8)
|
The implied financing benefit/cost of dollar roll income on TBAs is calculated using the average cost basis of TBAs as the denominator. TBA dollar roll income is the non-GAAP economic equivalent to holding and financing Agency RMBS using short-term repurchase agreements. TBAs are accounted for as derivative instruments in accordance with GAAP. For the third quarter of 2025, the implied cost of financing of TBAs, and thus the total annualized cost of financing, has been updated to conform to the current period presentation.
|
Conference Call
TWO will host a conference call on February 3, 2026 at 9:00 a.m. ET to discuss its fourth quarter 2025 financial results and related information. To participate in the teleconference, please call toll-free (800) 330-6710 approximately 10 minutes prior to the above start time and provide the Conference Code 2449958. The conference call will also be webcast live and accessible online in the News & Events section of the company’s website at www.twoinv.com. For those unable to attend, a replay of the webcast will be available on the company’s website approximately four hours after the live call ends.
About TWO
Two Harbors Investment Corp., or TWO, a Maryland corporation, is a real estate investment trust that invests in mortgage servicing rights, residential mortgage-backed securities, and other financial assets. TWO is headquartered in St. Louis Park, MN.
Forward-Looking Statements
This press release may contain “forward-looking statements,” including certain plans, expectations, goals, projections and statements about the benefits and synergies of the proposed transaction between TWO and UWMC; pro forma descriptions of the combined company and its operations, integration and transition plans, synergies and anticipated future performance; future opportunities for the combined company; TWO’s and UWMC’s plans, objectives, expectations and intentions, the expected timing of completion of the proposed transaction, the issuance of UWMC common stock and preferred stock in connection with the proposed transaction; the filing by UWMC with the Securities and Exchange Commission (“SEC”) of a registration statement on Form S-4 (the “Registration Statement”) and a proxy statement / prospectus included therein; the ability of the parties to complete the proposed transaction considering the various closing conditions; and other statements that are not historical facts. Such statements are subject to numerous assumptions, risks, and uncertainties. Statements that do not describe historical or current facts, including statements about beliefs and expectations, are forward-looking statements. The forward-looking statements are intended to be subject to the safe harbor provided by Section 27A of the Securities Act of 1933, as amended (the “Securities Act”) and Section 21E of the Securities Exchange Act of 1934, as amended, and the Private Securities Litigation Reform Act of 1995. All statements, other than statements of historical fact, included in this press release that address activities, events or developments that TWO or UWMC expects, believes or anticipates will or may occur in the future are forward-looking statements. Words such as “project,” “predict,” “believe,” “expect,” “anticipate,” “potential,” “create,” “estimate,” “plan,” “continue,” “intend,” “could,” “foresee,” “should,” “could,” “may,” “foresee,” “will,” “guidance,” “look,” “outlook,” “goal,” “future,” “assume,” “forecast,” “build,” “focus,” “work,” or the negative of such terms or other variations thereof and words and terms of similar substance used in connection with any discussion of future plans, actions, or events identify forward-looking statements. However, the absence of these words does not mean that the statements are not forward-looking. Pro forma, projected and estimated numbers are used for illustrative purposes only, are not forecasts and may not reflect actual results. These statements are not guarantees of future performance and involve certain risks, uncertainties and assumptions that are difficult to predict. TWO’s and UWMC’s ability to predict results or the actual effect of future events, actions, plans or strategies is inherently uncertain. Although TWO and UWMC believe the expectations reflected in any forward-looking statements are based on reasonable assumptions, the companies can give no assurance that their expectations will be attained and therefore, actual outcomes and results may differ materially from what is expressed or forecasted in such forward looking statements.
There are a number of risks and uncertainties that could cause actual results to differ materially from the forward-looking statements included in this press release. These include, among other things: the state of credit markets and general economic conditions; the rates of default or decreased recovery on the mortgages underlying TWO’s target assets; declines in home prices; TWO’s ability to establish, adjust and maintain appropriate hedges for the risks in its portfolio; the availability and cost of TWO’s target assets; the availability and cost of financing; changes in the competitive landscape within TWO’s industry; TWO’s ability to manage various operational risks and costs associated with its business, including the risks associated with operating a mortgage loan servicer and originator; interruptions in or impairments to TWO’s communications and information technology systems; TWO’s ability to acquire MSR and to maintain its MSR portfolio; TWO’s exposure to legal and regulatory claims; TWO’s ability to maintain its REIT qualification; limitations imposed on TWO’s business due to its REIT status and its exempt status under the Investment Company Act of 1940; the expected timing and likelihood of completion of the proposed transaction between TWO and UWMC; the ability to successfully integrate the businesses; the occurrence of any event, change or other circumstances that could give rise to the termination of the proposed transaction; the potential failure to receive, on a timely basis or otherwise, the required approvals of the proposed transaction, including stockholder approval by TWO’s stockholders, and the potential failure to satisfy the other conditions to the consummation of the proposed transaction in a timely manner or at all; risks relating to the value of the UWMC securities to be issued in the proposed transaction; risks related to disruption of management’s attention from ongoing business operations due to the proposed transaction; the risk that any announcements relating to the proposed transaction could have adverse effects on the market price of common stock of UWMC or TWO; the risk that the proposed transaction and its announcement could have an adverse effect on the ability of TWO and UWMC to retain and hire key personnel and the effect on the operating results and businesses of TWO and UWMC generally; the outcome of any legal proceedings relating to the proposed transaction; including stockholder litigation in connection with the proposed transaction; the risk that restrictions during the pendency of the proposed transaction may impact TWO’s or UWMC’s ability to pursue certain business opportunities or strategic transactions; that TWO or UWMC may be adversely affected by other economic, business or competitive factors; changes in future loan production; the availability of suitable investment opportunities; changes in interest rates; changes in the yield curve; changes in prepayment rates; the availability and terms of financing; conditions in the market for mortgage-related investments; legislative and regulatory changes that could adversely affect the business of TWO or UWMC. All such factors are difficult to predict and are beyond the control of TWO and UWMC, including those detailed in TWO’s annual reports on Form 10-K, quarterly reports on Form 10-Q and periodic reports on Form 8-K that are available on TWO’s website at www.twoinv.com/investors and on the SEC’s website at www.sec.gov, and those detailed in UWMC’s annual reports on Form 10-K, quarterly reports on Form 10-Q and periodic reports on Form 8-K that are available on UWMC’s website at https://investors.uwm.com/ and on the SEC’s website at www.sec.gov.
Each of the forward-looking statements of TWO or UWMC are based on assumptions that TWO or UWMC, as applicable, believes to be reasonable but that may not prove to be accurate. Any forward-looking statement speaks only as of the date on which such statement is made, and neither TWO nor UWMC undertakes any obligation to correct or update any forward-looking statement, whether as a result of new information, future events or otherwise, except as required by applicable law. Readers are cautioned not to place undue reliance on these forward-looking statements that speak only as of the date hereof.
IMPORTANT ADDITIONAL INFORMATION AND WHERE TO FIND IT
In connection with the proposed transaction, UWMC has filed with the SEC the Registration Statement that includes a preliminary proxy statement of TWO and also constitutes a prospectus of UWMC. The proposed transaction will be submitted to the stockholders of TWO for their approval. TWO and UWMC may also file other documents with the SEC regarding the proposed transaction. UWMC may not sell the common or preferred stock referenced in the preliminary proxy statement / prospectus until the Registration Statement filed with the SEC becomes effective. The preliminary proxy statement / prospectus and this press release are not offers to sell UWMC securities, are not soliciting an offer to buy UWMC securities in any state where the offer and sale is not permitted and are not a solicitation of any vote or approval. The definitive proxy statement / prospectus will be sent to the stockholders of TWO. This document is not a substitute for the Registration Statement and proxy statement / prospectus that will be filed with the SEC or any other documents that TWO or UWMC may file with the SEC or send to stockholders of TWO in connection with the proposed transaction. INVESTORS AND SECURITYHOLDERS OF TWO ARE ADVISED TO READ THE REGISTRATION STATEMENT AND THE PROXY STATEMENT / PROSPECTUS REGARDING THE PROPOSED TRANSACTION (INCLUDING ALL OTHER RELEVANT DOCUMENTS THAT ARE FILED OR WILL BE FILED WITH THE SEC, AS WELL AS ANY AMENDMENTS OR SUPPLEMENTS TO THESE DOCUMENTS) CAREFULLY AND IN THEIR ENTIRETY BECAUSE THEY WILL CONTAIN IMPORTANT INFORMATION ABOUT THE PROPOSED TRANSACTION AND RELATED MATTERS. Investors and securityholders may obtain a free copy of the Registration Statement and the proxy statement / prospectus and all other documents filed or that will be filed with the SEC by TWO or UWMC on the SEC’s website at www.sec.gov. Copies of documents filed with the SEC by TWO will be made available free of charge on TWO’s website at www.twoinv.com/investors or by directing a request to: Two Harbors Investment Corp., 1601 Utica Avenue South, Suite 900, St. Louis Park, MN 55416, Attention: Investor Relations. Copies of documents filed with the SEC by UWMC will be made available free of charge on UWMC's website at investors.uwm.com or by directing a request to: UWM Holdings Corporation, 585 South Boulevard E. Pontiac, Michigan, 48341, Attention: Investor Relations.
PARTICIPANTS IN THE SOLICITATION
TWO, UWMC and their directors, executive officers and certain other members of management and employees of TWO and UWMC may be deemed to be “participants” in the solicitation of proxies from the stockholders of TWO in connection with the proposed transaction. Securityholders can find information about TWO and its directors and executive officers and their ownership of TWO common stock in TWO’s annual report on Form 10-K for the fiscal year ended December 31, 2024 and in its definitive proxy statement relating to its 2025 annual meeting of stockholders filed with the SEC on April 2, 2025 (the “TWO 2025 Proxy”). Please refer to the sections captioned “Compensation Discussion and Analysis”, “Summary Compensation Table”, “Stock Ownership” and “Proposal 2: Advisory Vote Relating to Executive Compensation” in the TWO 2025 Proxy. Any changes in the holdings of TWO’s securities by its directors or executive officers from the amounts described in the TWO 2025 Proxy have been reflected in Statements of Change in Ownership on Form 4 filed with the SEC subsequent to the filing date of the TWO 2025 Proxy and are available on the SEC’s website at www.sec.gov. Information regarding UWMC’s directors and executive officers is available in UWMC’s Annual Report on Form 10-K for the fiscal year ended December 31, 2024 and in its definitive proxy statement relating to its 2025 annual meeting of stockholders filed with the SEC on April 25, 2025 (the “UWMC 2025 Proxy”). Please refer to the sections captioned “Compensation Discussion and Analysis”, “Executive Compensation”, “Stock Ownership” and “Proposal 3 – Advisory Vote on Executive Officer Compensation” in the UWMC 2025 Proxy. Any changes in the holdings of UWMC’s securities by its directors or executive officers from the amounts described in the UWMC 2025 Proxy have been reflected in Statements of Change in Ownership on Form 4 filed with the SEC subsequent to the filing date of the UWMC 2025 Proxy and are available on the SEC’s website at www.sec.gov. Additional information regarding the interests of such individuals in the proposed transaction will be included in the proxy statement / prospectus relating to the proposed transaction when it is filed with the SEC. Free copies of these documents may be obtained as described in the preceding paragraph.
NO OFFER OR SOLICITATION
This press release is for informational purposes only and is not intended to, and shall not, constitute an offer to sell or the solicitation of an offer to buy any securities or a solicitation of any vote or approval, nor shall there be any sale of securities in any jurisdiction in which such offer, solicitation or sale would be unlawful prior to registration or qualification under the securities laws of any such jurisdiction. No offering of securities shall be made except by means of a prospectus meeting the requirements of Section 10 of the Securities Act.
Non-GAAP Financial Measures
In addition to disclosing financial results calculated in accordance with United States generally accepted accounting principles (GAAP), this press release and the accompanying investor presentation present non-GAAP financial measures, such as earnings available for distribution and related per basic common share measures. The non-GAAP financial measures presented by the company provide supplemental information to assist investors in analyzing the company’s results of operations and help facilitate comparisons to industry peers. However, because these measures are not calculated in accordance with GAAP, they should not be considered a substitute for, or superior to, the financial measures calculated in accordance with GAAP. The company’s GAAP financial results and the reconciliations from these results should be carefully evaluated. See the GAAP to non-GAAP reconciliation table on page 13 of this release.
TWO HARBORS INVESTMENT CORP. |
CONSOLIDATED BALANCE SHEETS |
(dollars in thousands, except share data)
|
| December 31,
2025 |
| December 31,
2024 |
|
(unaudited)
|
|
|
ASSETS |
|
|
|
Available-for-sale securities, at fair value (amortized cost $6,516,016 and $7,697,027, respectively; allowance for credit losses $1,609 and $2,866, respectively)
|
$
|
6,514,471
|
|
|
$
|
7,371,711
|
|
Mortgage servicing rights, at fair value
|
|
2,421,910
|
|
|
|
2,994,271
|
|
Mortgage loans held-for-sale, at fair value
|
|
13,630
|
|
|
|
2,334
|
|
Cash and cash equivalents
|
|
842,319
|
|
|
|
504,613
|
|
Restricted cash
|
|
219,633
|
|
|
|
313,028
|
|
Accrued interest receivable
|
|
29,229
|
|
|
|
33,331
|
|
Due from counterparties
|
|
379,259
|
|
|
|
386,464
|
|
Derivative assets, at fair value
|
|
87,549
|
|
|
|
10,114
|
|
Reverse repurchase agreements
|
|
157,120
|
|
|
|
355,975
|
|
Other assets
|
|
194,097
|
|
|
|
232,478
|
|
Total Assets |
$
|
10,859,217
|
|
|
$
|
12,204,319
|
|
LIABILITIES AND STOCKHOLDERS’ EQUITY |
|
|
|
Liabilities: |
|
|
|
Repurchase agreements
|
$
|
7,255,540
|
|
|
$
|
7,805,057
|
|
Revolving credit facilities
|
|
919,371
|
|
|
|
1,020,171
|
|
Warehouse lines of credit
|
|
9,406
|
|
|
|
2,032
|
|
Senior notes
|
|
111,055
|
|
|
|
—
|
|
Convertible senior notes
|
|
261,810
|
|
|
|
260,229
|
|
Derivative liabilities, at fair value
|
|
4,254
|
|
|
|
24,897
|
|
Due to counterparties
|
|
215,814
|
|
|
|
648,643
|
|
Dividends payable
|
|
48,932
|
|
|
|
58,725
|
|
Accrued interest payable
|
|
81,914
|
|
|
|
85,994
|
|
Other liabilities
|
|
163,194
|
|
|
|
176,062
|
|
Total Liabilities |
|
9,071,290
|
|
|
|
10,081,810
|
|
Stockholders’ Equity: |
|
|
|
Preferred stock, par value $0.01 per share; 100,000,000 shares authorized and 24,870,817 shares issued and outstanding ($621,770 liquidation preference)
|
|
601,467
|
|
|
|
601,467
|
|
Common stock, par value $0.01 per share; 175,000,000 shares authorized and 104,806,311 and 103,680,321 shares issued and outstanding, respectively
|
|
1,048
|
|
|
|
1,037
|
|
Additional paid-in capital
|
|
5,948,478
|
|
|
|
5,936,609
|
|
Accumulated other comprehensive loss
|
|
(87
|
)
|
|
|
(320,524
|
)
|
Cumulative earnings
|
|
1,194,485
|
|
|
|
1,648,785
|
|
Cumulative distributions to stockholders
|
|
(5,957,464
|
)
|
|
|
(5,744,865
|
)
|
Total Stockholders’ Equity |
|
1,787,927
|
|
|
|
2,122,509
|
|
Total Liabilities and Stockholders’ Equity |
$
|
10,859,217
|
|
|
$
|
12,204,319
|
|
TWO HARBORS INVESTMENT CORP. |
CONSOLIDATED STATEMENTS OF COMPREHENSIVE INCOME (LOSS) |
(dollars in thousands, except per share amounts)
|
Certain prior period amounts have been reclassified to conform to the current period presentation |
| Three Months Ended |
| Year Ended |
| December 31, |
| December 31, |
| 2025 |
| 2024 |
| 2025 |
| 2024 |
|
(unaudited)
|
|
(unaudited)
|
|
|
Net interest expense: |
|
|
|
|
|
Interest income
|
$
|
89,919
|
|
|
$
|
103,774
|
|
|
$
|
411,998
|
|
|
$
|
450,152
|
|
Interest expense
|
|
105,408
|
|
|
|
138,668
|
|
|
|
490,943
|
|
|
|
607,806
|
|
Net interest expense
|
|
(15,489
|
)
|
|
|
(34,894
|
)
|
|
|
(78,945
|
)
|
|
|
(157,654
|
)
|
Net servicing income: |
|
|
|
|
|
|
|
Servicing income
|
|
145,062
|
|
|
|
167,568
|
|
|
|
626,723
|
|
|
|
681,648
|
|
Servicing costs
|
|
3,383
|
|
|
|
4,575
|
|
|
|
12,728
|
|
|
|
20,069
|
|
Net servicing income
|
|
141,679
|
|
|
|
162,993
|
|
|
|
613,995
|
|
|
|
661,579
|
|
Other (loss) income: |
|
|
|
|
|
|
|
Loss on investment securities
|
|
(14,432
|
)
|
|
|
(8,009
|
)
|
|
|
(96,178
|
)
|
|
|
(40,038
|
)
|
(Loss) gain on servicing asset
|
|
(65,213
|
)
|
|
|
82,520
|
|
|
|
(242,232
|
)
|
|
|
(62,674
|
)
|
Gain (loss) on derivative instruments
|
|
21,165
|
|
|
|
144,468
|
|
|
|
(91,484
|
)
|
|
|
106,854
|
|
Gain on mortgage loans held-for-sale
|
|
1,557
|
|
|
|
558
|
|
|
|
4,705
|
|
|
|
1,482
|
|
Other (loss) income
|
|
(714
|
)
|
|
|
850
|
|
|
|
5,199
|
|
|
|
1,199
|
|
Total other (loss) income
|
|
(57,637
|
)
|
|
|
220,387
|
|
|
|
(419,990
|
)
|
|
|
6,823
|
|
Expenses: |
|
|
|
|
|
|
|
Compensation and benefits
|
|
25,961
|
|
|
|
21,800
|
|
|
|
95,326
|
|
|
|
89,753
|
|
Other operating expenses
|
|
25,299
|
|
|
|
19,085
|
|
|
|
90,162
|
|
|
|
76,241
|
|
Litigation settlement expense
|
|
—
|
|
|
|
—
|
|
|
|
375,000
|
|
|
|
—
|
|
Total expenses
|
|
51,260
|
|
|
|
40,885
|
|
|
|
560,488
|
|
|
|
165,994
|
|
Income (loss) before income taxes |
|
17,293
|
|
|
|
307,601
|
|
|
|
(445,428
|
)
|
|
|
344,754
|
|
Provision for income taxes
|
|
5,576
|
|
|
|
30,872
|
|
|
|
8,872
|
|
|
|
46,586
|
|
Net income (loss) |
|
11,717
|
|
|
|
276,729
|
|
|
|
(454,300
|
)
|
|
|
298,168
|
|
Dividends on preferred stock
|
|
(13,042
|
)
|
|
|
(11,784
|
)
|
|
|
(52,791
|
)
|
|
|
(47,136
|
)
|
Gain on repurchase and retirement of preferred stock
|
|
—
|
|
|
|
—
|
|
|
|
—
|
|
|
|
644
|
|
Net (loss) income attributable to common stockholders |
$
|
(1,325
|
)
|
|
$
|
264,945
|
|
|
$
|
(507,091
|
)
|
|
$
|
251,676
|
|
Basic (loss) earnings per weighted average common share
|
$
|
(0.02
|
)
|
|
$
|
2.54
|
|
|
$
|
(4.88
|
)
|
|
$
|
2.41
|
|
Diluted (loss) earnings per weighted average common share
|
$
|
(0.02
|
)
|
|
$
|
2.37
|
|
|
$
|
(4.88
|
)
|
|
$
|
2.37
|
|
Comprehensive income (loss): |
|
|
|
|
|
|
|
Net income (loss) |
$
|
11,717
|
|
|
$
|
276,729
|
|
|
$
|
(454,300
|
)
|
|
$
|
298,168
|
|
Other comprehensive income (loss): |
|
|
|
|
|
|
|
Unrealized gain (loss) on available-for-sale securities
|
|
51,754
|
|
|
|
(266,565
|
)
|
|
|
320,437
|
|
|
|
(144,095
|
)
|
Other comprehensive income (loss)
|
|
51,754
|
|
|
|
(266,565
|
)
|
|
|
320,437
|
|
|
|
(144,095
|
)
|
Comprehensive income (loss) |
|
63,471
|
|
|
|
10,164
|
|
|
|
(133,863
|
)
|
|
|
154,073
|
|
Dividends on preferred stock
|
|
(13,042
|
)
|
|
|
(11,784
|
)
|
|
|
(52,791
|
)
|
|
|
(47,136
|
)
|
Gain on repurchase and retirement of preferred stock
|
|
—
|
|
|
|
—
|
|
|
|
—
|
|
|
|
644
|
|
Comprehensive income (loss) attributable to common stockholders |
$
|
50,429
|
|
|
$
|
(1,620
|
)
|
|
$
|
(186,654
|
)
|
|
$
|
107,581
|
|
TWO HARBORS INVESTMENT CORP. |
INTEREST INCOME AND INTEREST EXPENSE |
(in thousands)
|
|
| Three Months Ended |
| Year Ended |
| December 31, |
| December 31, |
| 2025 |
| 2024 |
| 2025 |
| 2024 |
|
(unaudited)
|
|
(unaudited)
|
Interest income: |
|
|
|
|
|
Available-for-sale securities
|
$
|
81,964
|
|
|
$
|
92,644
|
|
|
$
|
374,987
|
|
|
$
|
393,527
|
|
Mortgage loans held-for-sale
|
|
203
|
|
|
|
49
|
|
|
|
526
|
|
|
|
78
|
|
Other
|
|
7,752
|
|
|
|
11,081
|
|
|
|
36,485
|
|
|
|
56,547
|
|
Total interest income
|
|
89,919
|
|
|
|
103,774
|
|
|
|
411,998
|
|
|
|
450,152
|
|
Interest expense: |
|
|
|
|
|
|
|
Repurchase agreements
|
|
81,084
|
|
|
|
112,510
|
|
|
|
388,341
|
|
|
|
468,492
|
|
Revolving credit facilities
|
|
16,080
|
|
|
|
21,597
|
|
|
|
75,691
|
|
|
|
108,623
|
|
Warehouse lines of credit
|
|
129
|
|
|
|
55
|
|
|
|
424
|
|
|
|
66
|
|
Term notes payable
|
|
—
|
|
|
|
—
|
|
|
|
—
|
|
|
|
12,426
|
|
Senior notes
|
|
2,884
|
|
|
|
—
|
|
|
|
7,264
|
|
|
|
—
|
|
Convertible senior notes
|
|
4,532
|
|
|
|
4,506
|
|
|
|
17,949
|
|
|
|
18,199
|
|
Other
|
|
699
|
|
|
|
—
|
|
|
|
1,274
|
|
|
|
—
|
|
Total interest expense
|
|
105,408
|
|
|
|
138,668
|
|
|
|
490,943
|
|
|
|
607,806
|
|
Net interest expense
|
$
|
(15,489
|
)
|
|
$
|
(34,894
|
)
|
|
$
|
(78,945
|
)
|
|
$
|
(157,654
|
)
|
TWO HARBORS INVESTMENT CORP. |
RECONCILIATION OF GAAP TO NON-GAAP FINANCIAL INFORMATION |
(dollars in thousands, except share data)
|
Certain prior period amounts have been reclassified to conform to the current period presentation |
|
|
|
|
| Three Months Ended |
| December 31,
2025 |
| September 30,
2025 |
|
(unaudited)
|
|
(unaudited)
|
Reconciliation of comprehensive income (loss) to Earnings Available for Distribution:
|
|
|
|
Comprehensive income (loss) attributable to common stockholders
|
$
|
50,429
|
|
|
$
|
(80,207
|
)
|
Adjustment for other comprehensive income attributable to common stockholders:
|
|
|
|
Unrealized gain on available-for-sale securities
|
|
(51,754
|
)
|
|
|
(61,038
|
)
|
Net loss attributable to common stockholders
|
$
|
(1,325
|
)
|
|
$
|
(141,245
|
)
|
Adjustments to exclude reported realized and unrealized (gains) losses:
|
|
|
|
Realized loss on securities
|
|
15,018
|
|
|
|
16,012
|
|
Unrealized (gain) loss on securities
|
|
(578
|
)
|
|
|
266
|
|
Reversal of provision for credit losses
|
|
(8
|
)
|
|
|
(91
|
)
|
Realized and unrealized loss on mortgage servicing rights
|
|
65,213
|
|
|
|
104,896
|
|
Realized and unrealized gain on derivative instruments
|
|
(13,121
|
)
|
|
|
(55,692
|
)
|
Other losses (gains)
|
|
2,590
|
|
|
|
(2,304
|
)
|
Other adjustments:
|
|
|
|
MSR amortization(1) |
|
(69,700
|
)
|
|
|
(78,902
|
)
|
TBA dollar roll income(2) |
|
12,409
|
|
|
|
10,371
|
|
U.S. Treasury futures income(3) |
|
4,471
|
|
|
|
5,006
|
|
Change in servicing reserves
|
|
(322
|
)
|
|
|
(508
|
)
|
Non-cash equity compensation expense
|
|
3,352
|
|
|
|
1,544
|
|
Certain operating expenses(4) |
|
4,209
|
|
|
|
4,066
|
|
Litigation settlement expense
|
|
—
|
|
|
|
175,065
|
|
Net provision for (benefit from) income taxes on non-EAD
|
|
5,227
|
|
|
|
(1,330
|
)
|
Earnings available for distribution to common stockholders(5) |
$
|
27,435
|
|
|
$
|
37,154
|
|
Weighted average basic common shares
|
|
104,239,402
|
|
|
|
104,144,560
|
|
Earnings available for distribution to common stockholders per weighted average basic common share
|
$
|
0.26
|
|
|
$
|
0.36
|
|
________________________
|
(1)
|
MSR amortization refers to the portion of change in fair value of MSR primarily attributed to the realization of expected cash flows (runoff) of the portfolio, which is deemed a non-GAAP measure due to the company’s decision to account for MSR at fair value.
|
(2)
|
TBA dollar roll income is the economic equivalent to holding and financing Agency RMBS using short-term repurchase agreements.
|
(3)
|
U.S. Treasury futures income is the economic equivalent to holding and financing a relevant cheapest-to-deliver U.S. Treasury note or bond using short-term repurchase agreements.
|
(4)
|
Certain operating expenses predominantly consists of transaction expenses incurred in connection with the company’s proposed merger with UWMC and the company’s litigation with its former external manager.
|
(5)
|
EAD is a non-GAAP measure that we define as comprehensive income (loss) attributable to common stockholders, excluding realized and unrealized gains and losses on the aggregate investment portfolio, gains and losses on repurchases of preferred stock, provision for (reversal of) credit losses, reserve expense for representation and warranty obligations on MSR, non-cash compensation expense related to restricted common stock, certain operating expenses and litigation settlement expense. As defined, EAD includes net interest income, accrual and settlement of interest on derivatives, dollar roll income on TBAs, U.S. Treasury futures income, servicing income, net of estimated amortization on MSR and certain cash related operating expenses. EAD provides supplemental information to assist investors in analyzing the company’s results of operations and helps facilitate comparisons to industry peers. EAD is one of several measures our board of directors considers to determine the amount of dividends to declare on our common stock and should not be considered an indication of our taxable income or as a proxy for the amount of dividends we may declare.
|

View source version on businesswire.com: https://www.businesswire.com/news/home/20260202237666/en/
Contacts:
Margaret Karr, Head of Investor Relations, TWO, (612)-453-4080, Margaret.Karr@twoinv.com
Source: Two Harbors Investment Corp.
© 2026 Canjex Publishing Ltd. All rights reserved.