Four VMS Deposits Defined from Surface with Mineral Resources Open in All Directions
10.04 Million Tonnes @ 1.0% CuEq*1 Indicated Plus 18.15 Million Tonnes @ 1.7% CuEq*1 Inferred
Co-Funding Received from Manitoba Mineral Development Fund
Vancouver, British Columbia--(Newsfile Corp. - May 7, 2026) - T2 Metals Corp. (TSXV: TWO) (OTCQB: TWOSF) (FSE: WJ6) ("T2 Metals" or the "Company") is pleased to announce the results of an independent NI 43-101 Mineral Resource Estimate ("MRE") for its Sherridon Copper-Zinc-Gold-Silver Project ("Sherridon" or the "Project") in the Flin Flon–Snow Lake Greenstone Belt of west-central Manitoba. The substantial Inferred and Indicated Mineral Resources at shallow depth defines Sherridon as a leading copper development opportunity in central Canada.
The MRE encompasses four near-surface, copper-dominant volcanogenic massive sulphide ("VMS") deposits: Bob, Cold Lake, Lost Lake and Jungle (Tables 1a & 1b). Together these deposits form part of a well-defined mineralized horizon that has been traced for over 25 km of strike length at Sherridon.
The historical Sherritt Gordon East and West Mines — which produced 7.74 million tonnes grading 2.46% Cu, 2.84% Zn, 0.6 g/t Au and 33 g/t Ag between 1931 and 1951 (Goetz, P.A. and Froese, E., 1981) — are interpreted to lie on the same mineralized horizon as the four deposits now defined in this MRE, providing strong geological validation of the camp's high-grade and future exploration potential.
Highlights
Total Indicated Mineral Resource of 10.04 million tonnes (Mt) grading 0.39% Cu, 0.83% Zn, 0.30 g/t Au and 4.75 g/t Ag (equal to 1.0% CuEq*1) (see Table 1a);
Total Inferred Mineral Resource of 18.15 million tonnes grading 1.08% Cu, 1.00% Zn, 0.27 g/t Au and 7.05 g/t Ag (equal to 1.7% CuEq*1) (see Table 1b);
Mineral resources in the Indicated category exceed 35% of total resource, demonstrating a high degree of confidence;
Project contains 86 million lb of copper and 96,000 oz of gold in the Indicated category and 430 million lb of copper and 158,000 oz gold in the Inferred category;
Most mineralization is accessible within shallow open pits. High-grade near-surface mineralization at Cold Lake and Lost Lake deposits provide excellent near-term mining opportunities;
Three of the four deposits — Bob, Cold Lake and Lost Lake — remain open along strike and at depth where significant expansion upside has been identified. Jungle has been partially drill constrained;
Past mining data and more recent drill intercepts which include 23.50 m @ 1.18% Cu, 6.8 g/t Au, 40.4 g/t Ag and 1.46% Zn (SH23005) demonstrate very high-grade potential;
Historical drilling data for the Park deposit has been recently received from Hudbay Minerals which is now being reviewed as an additional resource calculation opportunity;
Scale and grade of the MRE supports advancement of Sherridon to a Preliminary Economic Assessment (PEA);
T2 Metals gratefully acknowledges the financial support of the Manitoba Mineral Development Fund ("MMDF"), which provided C$75,000 in co-funding support for the mineral resource estimation program.
CuEq*1 (copper equivalent) = Cu% + (Zn% × 0.2346) + (Au g/t × 0.00721) + (Ag g/t × 0.00008). See Table 1 for full details of methodology.
Sherridon is located only 65 km from Flin Flon (Figure 1) and 120 km from the McIlvenna Bay development project — recently the subject of a C$3.8 billion acquisition of Foran Mining by Eldorado Gold. Sherridon has year-round road access and an active rail line passing the property, a rare logistics advantage for future development. Deposits are all sited within 8 km of the Sherridon Village where historical mining took place (Figure 2).
Mark Saxon, President and CEO of T2 Metals, commented, "This NI 43-101 resource at Sherridon confirms what we have long believed, that this is a robust VMS system with scale, grade, and clear growth potential. Importantly, we are not dealing with a single isolated deposit, but a camp with multiple mineralized centres. To date all seven deposits have been discovered in outcrop – we are very confident more deposits will be discovered at depth.
"Cold Lake, Lost Lake, Jungle and Bob collectively provide a strong foundation for development, and we see clear opportunities to expand these resources with further drilling. With this initial resource in hand, we are well positioned to advance Sherridon to the next stage. I thank our exploration team and our partners, the Kiciwapa Cree Nation, for supporting us to achieve this milestone."
Janessa Kosar North, CEO of the Kiciwapa Cree Nation, said, "The Kiciwapa Cree Nation is very pleased to see the progress being made by T2 Metals and supports the advancement of the Sherridon resource. We value the respectful and collaborative relationship that we have built with T2 Metals and look forward to continuing to strengthen that relationship as the project moves forward. This project holds real potential, and we are optimistic about the opportunities it can bring to our community."
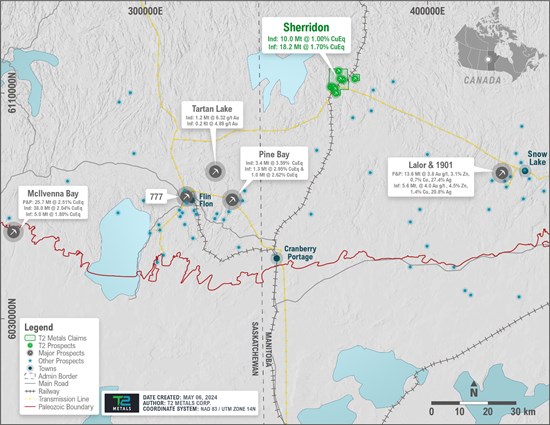
Figure 1: Regional Location of the Sherridon Project, Manitoba, Canada.
See Appendix 1 for additional information on resource-stage projects and supporting references.
To view an enhanced version of this graphic, please visit:
https://images.newsfilecorp.com/files/7326/296382_c9ce0e7be460c8ac_002full.jpg
Table 1a: Sherridon Project Mineral Resource Estimate (Indicated) — Effective Date April 22, 2026, Rounded.
| Deposit | Mine Type | Cut Off (US$/t) | NSR (US$/t) | Million Tonnes | Cu % | Zn % | Au g/t | Ag g/t | Cu (M lb) | Zn (M lb) | CuEq (%) |
| INDICATED |
| Cold Lake | OP | 20 | 70.1 | 0.65 | 0.35 | 0.66 | 0.32 | 7.00 | 5.03 | 9.48 | 0.91 |
| Cold Lake | UG | 55 | 74.2 | 0.31 | 0.32 | 0.58 | 0.46 | 7.00 | 2.21 | 40.00 | 0.94 |
| Lost Lake | OP | 20 | 141.3 | 1.89 | 0.61 | 2.25 | 0.59 | 8.00 | 25.48 | 93.97 | 2.13 |
| Bob | OP | 20 | 57.6 | 3.23 | 0.34 | 0.33 | 0.27 | 3.90 | 24.22 | 23.50 | 0.69 |
| Bob | UG | 55 | 72.5 | 0.99 | 0.34 | 0.64 | 0.40 | 5.02 | 7.43 | 13.99 | 0.93 |
| Jungle | OP | 20 | 41.8 | 2.31 | 0.33 | 0.3 | 0.08 | 2.83 | 16.77 | 15.25 | 0.53 |
| Jungle | UG | 55 | 67.1 | 0.65 | 0.33 | 1.58 | 0.09 | 2.5 | 4.74 | 22.70 | 1.17 |
| TOTAL INDICATED |
| Total Indicated | OP | 20 | 73.7 | 8.08 | 0.4 | 0.8 | 0.3 | 4.8 | 71.49 | 142.20 | 1.0 |
| Total Indicated | UG | 55 | 71.0 | 1.96 | 0.3 | 0.9 | 0.3 | 4.5 | 14.38 | 40.70 | 1.0 |
Table 1b: Sherridon Project Mineral Resource Estimate (Inferred) — Effective Date April 22, 2026, Rounded.
| Deposit | Mine Type | Cut Off (US$/t) | NSR (US$/t) | Million Tonnes | Cu % | Zn% | Au G/t | Ag g/t | Cu (M lb) | Zn (M lb) | CuEq (%) |
| INFERRED |
| Cold Lake | OP | 20 | 203.2 | 0.42 | 1.42 | 2.08 | 0.34 | 21 | 13.14 | 19.24 | 2.7 |
| Lost Lake | OP | 20 | 248.3 | 0.48 | 1.38 | 3.31 | 0.76 | 17 | 14.44 | 34.61 | 3.5 |
| Bob | OP | 20 | 124.4 | 5.82 | 0.97 | 0.8 | 0.28 | 6 | 124.40 | 102.73 | 1.5 |
| Bob | UG | 55 | 136.2 | 4.19 | 1.04 | 0.96 | 0.3 | 7.29 | 95.94 | 88.56 | 1.7 |
| Jungle | OP | 20 | 147.9 | 2.88 | 1.23 | 0.78 | 0.28 | 6.75 | 77.90 | 49.43 | 1.8 |
| Jungle | UG | 55 | 131.1 | 4.38 | 1.08 | 1.08 | 0.16 | 5.35 | 104.26 | 104.25 | 1.7 |
| TOTAL INFERRED |
| Total Inferred | OP | 20 | 141.0 | 9.59 | 1.1 | 1.0 | 0.3 | 7.7 | 229.88 | 206.01 | 1.7 |
| Total Inferred | UG | 55 | 133.6 | 8.57 | 1.1 | 1.0 | 0.2 | 6.3 | 200.20 | 192.81 | 1.7 |
Notes:
- Mineral Resource Estimates are not a Mineral Reserves and do not have demonstrated economic viability. There is no certainty that all or any part of the Mineral Resource estimated will be converted into a Mineral Reserve.
- Mineral resources are estimated at a NSR cut-off of US$20 per tonne and US$55 per tonne for open pit and underground respectively.
- Metal prices used are US$5.00/lb copper, US$1.3/lb zinc, US$3,500/oz gold, US$0.85/lb lead and US$45.00/oz silver.
- Metallurgical recovery factors assumed were 92% for copper, 83% for zinc, 65% for gold and 57% for silver.
- The Mineral Resource Estimate (MRE) are reported at a cut-off grade to reflect reasonable prospects for economic extraction, which were evaluated by designing a series of conceptual pit shells using the Lerchs-Grossman optimizing algorithm.
- Common values for operating costs and smelter terms were assumed.
- Numbers may not sum exactly due to rounding.
- Copper equivalent (CuEq) values were calculated using metal prices of US$5.00/lb copper, US$1.30/lb zinc, US$3,500/oz gold and US$45.00/oz silver, with metallurgical recovery factors of 92% for copper, 83% for zinc, 65% for gold and 57% for silver. The formula applied was: CuEq% = Cu% + (Zn% × 0.2346) + (Au g/t × 0.00721) + (Ag g/t × 0.00008). The CuEq formula has not been adjusted for differential smelting, refining or transport charges. The Company believes the assumed metal prices and recoveries are reasonable, but they are not guaranteed. CuEq values are provided for illustrative purposes only and are not necessarily indicative of economic viability.
- The MRE was prepared by Geoffrey Reed, MAIG, MAusIMM (QP) Geo, of ReedLeyton Consulting Pty Ltd, independent Qualified Person, NI 43-101.
The Mineral Resource Estimate was prepared by Mr. Geoffrey Reed, MAIG, MAusIMM (QP) Geo, of ReedLeyton Consulting Pty Ltd, an independent Qualified Person as defined by National Instrument 43-101 – Standards of Disclosure for Mineral Projects. Mr. Reed has reviewed and approved the technical information contained in this news release.
A National Instrument 43-101 technical report supporting the Mineral Resource Estimate will be filed on SEDAR+ within 45 days of the date of this news release. The technical report will be co-authored by Mr. Anders Hogrelius, P.G. RPGeo SME-RM, of Hogrelius Geological Consultants., and Mr. Bouke van `t Riet, (QP) ENG, of Arundon Mining Solutions Oy, both independent Qualified Persons under NI 43-101.
Property Description and Setting
The Sherridon Project is located approximately 65 km northeast of the town of Flin Flon, Manitoba. It is comprised of 34 mineral claims that total 5,380 hectares and one mineral lease that totals 486 hectares bringing the total land package to approximately 5,866 hectares 100% held by T2 Metals. Year-round access is provided by a well-maintained road network, while an operational rail line passes directly through the project area, offering a material infrastructure advantage that pre-development projects can claim.
Sherridon sits within the Flin Flon–Snow Lake Greenstone Belt, one of the world's most prolific VMS-producing geological terranes. The broader district has hosted over 35 VMS deposits and produced more than 150 million tonnes of ore. Immediately south, Hudbay Minerals' historic Flin Flon Mine produced copper-zinc ore for over 100 years; to the east, Hudbay's Snow Lake operations continue production.
The Cold Lake, Lost Lake, Bob and Jungle deposits are all sited within 8 km of the Sherridon Village where historical mining took place. The Park deposit which is not the subject of the current MRE (see News Release dated 1 Nov, 2024 for details of the Park historical resource) lies 7 km from the Sherridon Village and 3 km from the Bob deposit and is being considered for future mineral resource estimation.
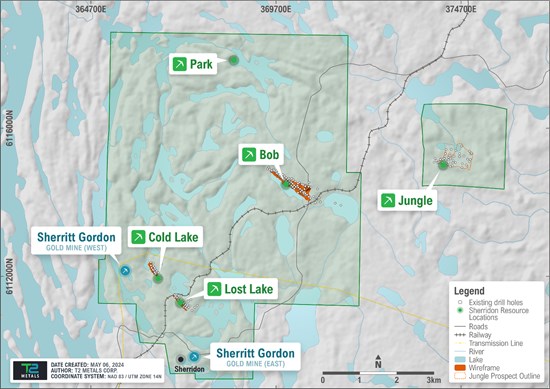
Figure 2: Location of NI 43-101 Mineral Resource Estimates, Sherridon Project, Manitoba, Canada.
To view an enhanced version of this graphic, please visit:
https://images.newsfilecorp.com/files/7326/296382_c9ce0e7be460c8ac_005full.jpg
Deposit Descriptions and Resource Highlights
Bob Deposit
The Bob deposit (Figure 3) is the most extensively drilled of the four resource areas with 78 drillholes and forms the cornerstone of the Sherridon MRE. Mineralization is comprised of two broadly parallel massive to semi-massive sulphide lenses of chalcopyrite-sphalerite-pyrite. The deposit has been defined over 1,300 m of strike and 260 m of down-dip extent and remains open in both directions. Drill highlights supporting the resource include:
DH08-125: 39.4 m @ 0.97% Cu, 0.67% Zn, 0.23 g/t Au, 6.36 g/t Ag
DH07-061: 24.9 m @ 1.22% Cu, 0.87% Zn, 0.49 g/t Au, 8.02 g/t Ag
SL046: 19.3 m @ 1.31% Cu, 0.27% Zn, 0.30 g/t Au, 6.75 g/t Ag
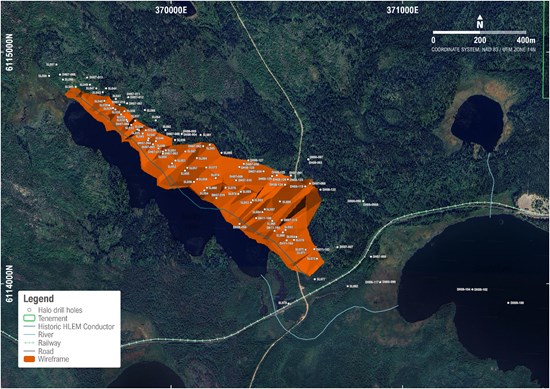
Figure 3: Location of Bob NI 43-101 Mineral Resource Estimate April 2026, Sherridon Project, Manitoba, Canada.
To view an enhanced version of this graphic, please visit:
https://images.newsfilecorp.com/files/7326/296382_c9ce0e7be460c8ac_007full.jpg
Cold Lake Deposit
The Cold Lake deposit (Figure 4) has been tested with 24 drillholes and lies approximately 1 km east of the former Sherritt Gordon West Mine, with similar VMS mineralogy and alteration characteristics. Mineralization begins at surface and has been defined over 540 m of strike and 180 m of down-dip extent. Significant mineralized intercepts include:
DH10-156: 20.9 m @ 2.27% Cu, 3.46% Zn, 2.15 g/t Au, 39.68 g/t Ag
DH07-044: 26.0 m @ 1.15% Cu, 1.39% Zn, 0.56 g/t Au, 14.46 g/t Ag
SHN23010: 6.00 m @ 1.65% Cu, 1.44% Zn, 2.14 g/t Au, 34.64 g/t Ag
Lost Lake Deposit
The Lost Lake deposit (Figure 5, Figure 6) has been tested with 35 drillholes and lies as a southern strike extension to the Cold Lake deposit. The Lost Lake MRE demonstrates down-plunge extension potential, with the 2024 T2 Metals drill program intersecting significant mineralization approximately 250 m beyond the resource footprint. Mineralization remains near-surface and has been defined over 530 m of strike and 120 m of down-dip extent. Significant mineralized intercepts include:
SHN23005: 24.0 m @ 1.17% Cu, 1.43% Zn, 6.39 g/t Au, 38.64 g/t Ag
DH09-137: 29.6 m @ 1.03% Cu, 0.76% Zn, 0.93 g/t Au, 18.25 g/t Ag
DH09-138: 19.1 m @ 1.55% Cu, 3.96% Zn, 0.61 g/t Au, 16.55 g/t Ag
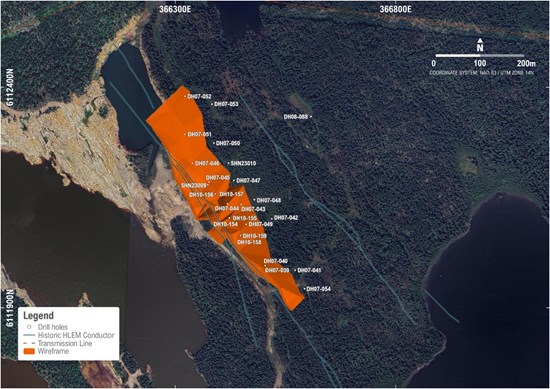
Figure 4: Location of Cold Lake NI 43-101 Mineral Resource Estimate April 2026, Sherridon Project, Manitoba, Canada.
To view an enhanced version of this graphic, please visit:
https://images.newsfilecorp.com/files/7326/296382_c9ce0e7be460c8ac_008full.jpg
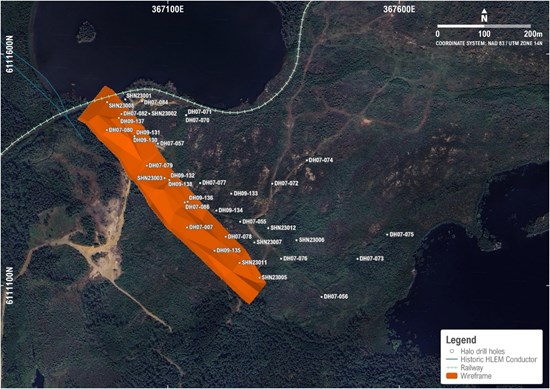
Figure 5: Location of Lost Lake NI 43-101 Mineral Resource Estimate April 2026, Sherridon Project, Manitoba, Canada.
To view an enhanced version of this graphic, please visit:
https://images.newsfilecorp.com/files/7326/296382_c9ce0e7be460c8ac_010full.jpg
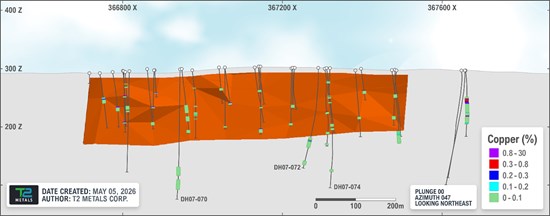
Figure 6: Long Section of Lost NI 43-101 Mineral Resource Estimate Wireframe April 2026, Sherridon Project, Manitoba, Canada.
To view an enhanced version of this graphic, please visit:
https://images.newsfilecorp.com/files/7326/296382_c9ce0e7be460c8ac_011full.jpg
Jungle Deposit
The Jungle deposit (Figure 7) represents an additional lens of copper-dominant VMS-style mineralization 4 km east of the Bob deposit. Jungle has been relatively lightly drill-tested compared to Bob and Cold Lake, and T2 Metals considers Jungle to hold significant near-term potential for resource expansion through targeted infill and step-out drilling. Mineralization remains near-surface and has been defined over 900 m of strike and varies between 200 – 680 m of down-dip extent. Significant mineralized intercepts include:
DH07-021: 18.7 m @ 1.36% Cu, 0.63% Zn, 0.40 g/t Au, 7.60 g/t Ag
DH07-028: 30.7 m @ 0.84% Cu, 0.19% Zn, 0.20 g/t Au, 6.03 g/t Ag
NOK050: 9.6 m @ 2.16% Cu, 0.85% Zn, 0.01 g/t Au, 3.74 g/t Ag
Geology and Mineralization
All four Sherridon deposits display characteristic features of VMS deposits within the Flin Flon–Snow Lake Greenstone Belt: they are hosted within calc-alkaline mafic-felsic volcanic sequences of Paleoproterozoic age, exhibit well-developed footwall alteration (chlorite-sericite-quartz assemblages), and contain massive to semi-massive sulphide ore dominated by chalcopyrite, sphalerite, and pyrite with local galena.
The mineralized horizon at Sherridon is well-mapped over more than 25 km of multiply folded strike length. The four MRE deposits are interpreted as discrete lenses that thicken and thin along-strike, largely open for additional discovery down dip and along strike. Multiple additional exploration targets have been identified along strike and off-strike using downhole electromagnetics (DHEM) during drilling programs, providing a clear roadmap for future resource growth.
Past mining at Sherridon gives insight into the mining methods and traditional mineral processing opportunities for the style of massive sulphide mineralization present in the MRE deposits.
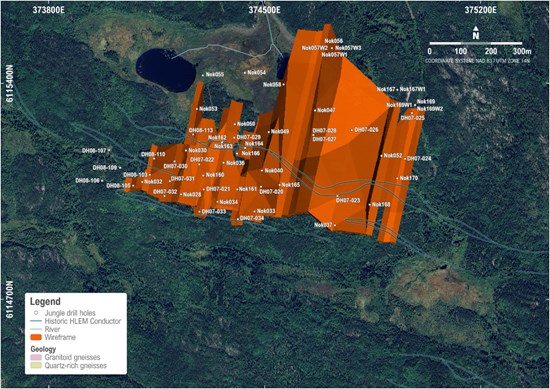
Figure 7: Location of Jungle NI 43-101 Mineral Resource Estimate April 2026, Sherridon Project, Manitoba, Canada.
To view an enhanced version of this graphic, please visit:
https://images.newsfilecorp.com/files/7326/296382_c9ce0e7be460c8ac_013full.jpg
Resource Estimation Methodology
The Mineral Resource Estimate was prepared by Geoffrey Reed, MAIG, MAusIMM (QP) Geo, of ReedLeyton Consulting Pty Ltd, in accordance with NI 43-101 and CIM Definition Standards for Mineral Resources and Mineral Reserves (2014).
The Bob MRE is based on 78 NQ/HQ diamond drill holes totalling 14,327 m of drilling.
The Cold Lake MRE is based on 24 NQ/HQ diamond drill holes totalling 3,016.3 m of drilling, comprising 3 holes drilled by T2 Metals from 2023 to 2025 together with 21 historical holes from previous operators, validated by T2 Metals' QA/QC program.
The Lost Lake MRE is based on 25 NQ/HQ diamond drill holes totalling 2,966.8 m of drilling, comprising 7 holes drilled by T2 Metals from 2023 to 2025 together with 18 historical holes from previous operators, validated by T2 Metals' QA/QC program.
The Jungle MRE is based on 45 NQ/HQ diamond drill holes totalling 10,002 m of drilling.
A complete description of the data verification, sampling procedures, analytical methods, and QA/QC program is provided in the supporting NI 43-101 Technical Report, which will be filed on SEDAR+ within 45 days of this news release.
Key Estimation Parameters
Three-dimensional mineralization wireframes were constructed for each deposit in Maptek Vulcan Software using lithological, and assay criteria. An outer three-dimensional mineralization wireframe was based on lithology (Domain 100) and an inner three-dimensional mineralization was based on copper assay criteria (Domain 200).
Grade estimation by ordinary kriging and check grade estimation inverse distance using 1 m composite lengths except for Jungle where 0.6 m and 1.2 m composite lengths were applied.
Block model dimensions: [10] x [10] x [10] metres and Sub-block [5] x [5] x [2]
High-grade capping applied:
Bob: Ag 25 g/t and Zn 4%
Cold Lake: Au 5 g/t and Zn 12%
Lost Lake: Au 6 g/t Ag 50 g/t for Domain 100 only
Jungle: Domain 100 Cu 0.8%, Ag 15 ppm, Au 0.7 g/t, Zn 3.5 ppm, Domain 200 Cu 4%, Ag 20 g/t, Au 1.5 g/t, Zn 3ppm
NSR cut-off grades: US$20/t (open pit), based on estimated mining, processing and site operating costs, and US$55/t (underground), based on estimated marginal operating costs, using current metal price assumptions.
Bulk density determinations (Table 2) were available in each of the four mineralized deposits. Since bulk density is a function of sulphide content, a variable Cu+Zn+Pb was created for each sample containing a specific gravity determination. The correlation between this combined sulphide variable and BD was as follows:
Table 2: Sherridon Project Bulk Density Measurements.
Bulk Density FOR BOB, COLD AND LOST DEPOSITS
AS A FUNCTION OF CU+ZN+PB GRADES |
| Deposit | Cu+Zn+Pb
Range | Number | Average
Cu+Zn+Pb | Average
SG |
| Bob | 0 to 0.1% | 25 | 0.040 | 2.72 |
| = 0.1 < 0.5% | 26 | 0.230 | 2.81 |
| = 0.5 <2.0% | 11 | 1.210 | 3.26 |
| = 2.0% | 18 | 3.960 | 3.74 |
| Cold Lake | 0 to 0.1% | 395 | 0.022 | 2.74 |
| = 0.1 < 0.5% | 85 | 0.265 | 2.77 |
| = 0.5 < 2.0% | 71 | 1.125 | 2.84 |
| = 2.0% | 56 | 6.423 | 3.19 |
| Lost Lake | 0 to 0.1% | 134 | 0.022 | 2.75 |
| = 0.1 < 0.5% | 19 | 0.260 | 2.77 |
| = 0.5 < 2.0% | 8 | 1.003 | 2.84 |
| = 2.0% | 10 | 11.194 | 3.29 |
Classification of Mineral Resources - the geologic continuity of the Bob, Cold and Lost deposits has been established through diamond drilling. Grade continuity can be quantified by semivariogram analysis.
Within these deposits, the drill hole spacing, when compared with the semivariogram ranges, precludes the classification of any measured material at this time. For the Cold and Lost deposits, blocks estimated in Pass 1 or Pass 2 for copper, using search ellipses of up to ½ the semivariogram ranges for each variable were classed as Indicated Resources. The remaining blocks were classified as Inferred Resources.
For the Bob and Jungle deposits, zinc and copper had much different semivariogram ranges and as a result, blocks estimated in Pass 1 or Pass 2 for both copper and zinc, using search ellipses of up to ½ the semivariogram range were classed as Indicated Resources. All remaining blocks were classified as Inferred Resources.
A complete description of the data verification, sampling procedures, analytical methods, and QA/QC program is provided in the supporting NI 43-101 Technical Report, which will be filed on SEDAR+ within 45 days of this news release.
Infrastructure and Logistics
Few undeveloped copper projects in Canada hold the infrastructure profile that Sherridon enjoys. The Project benefits from:
An operational First Nations owned rail line passing directly through the property, providing direct connection to processing facilities, smelters and ports;
Year-round all-weather road access from the town of Sherridon and the broader highway network;
Proximity to the Flin Flon mining community, providing access to an experienced mining workforce, equipment suppliers, and established services;
Existing exploration camp and drill site infrastructure from previous programs;
Grid electricity available at the Sherridon Village;
These attributes will substantially reduce capital requirements and permitting timelines for a potential future mining operation and represent a material competitive advantage for project development.
Next Steps
With a NI 43-101 compliant mineral resource now established across all four deposits, T2 Metals is evaluating the following work programs:
Mineralogical and metallurgical test program: metallurgical characterisation of each deposit to underpin process design and financial modelling;
Environmental baseline studies: commencement of baseline environmental data collection to support future permitting activities;
Resource expansion drilling: targeted drill program to test down-plunge and along-strike extensions;
Park deposit NI 43-101 resource estimate: historical drilling data recently received from Hudbay Minerals is being reviewed and validated with a view to upgrading the Park deposit's historical resource to a NI 43-101 compliant Mineral Resource Estimate; and
Preliminary Economic Assessment (PEA): T2 Metals is reviewing commencement of a PEA to evaluate the economics of developing the Sherridon deposits;
T2 Metals gratefully acknowledges the financial support of the Manitoba Mineral Development Fund ("MMDF"), which provided C$75,000 in co-funding support for the mineral resource estimation program at the Sherridon Project. The MMDF's contribution has been instrumental in advancing this work, and T2 Metals wishes to recognise the Manitoba government's ongoing commitment to responsible and sustainable mineral development in the province. The Company looks forward to continuing to work collaboratively with the MMDF, the Province of Manitoba and other rights holders and stakeholders as the Sherridon Project advances.
Qualified Person
The Company has retained independent consultants, ReedLeyton Consulting, Arundon Mining Solutions Oy and Hogrelius Geological Consultants, to act as the Qualified Persons (QPs) for the MRE.
The scientific and technical information in this news release, including the Mineral Resource Estimate, has been prepared and reviewed by Geoffrey Reed, MAIG, MAusIMM (QP) Geo (Licence No. 7406,205422), of ReedLeyton Consulting, who is independent of T2 Metals Corp. and serves as the Qualified Person for the purposes of NI 43-101. Geoffrey Reed has verified the data disclosed herein, including the sampling, analytical, and QA/QC procedures underlying the resource estimate, and has approved the disclosure of the scientific and technical information contained in this release.
The scientific and technical information in this news release, including the Mineral Resource Estimate, has been prepared and reviewed by Anders Hogrelius, P.G. MAIG, SME-RM (QP) Geo (Licence No(s). 10226, 04274092), of Hogrelius Geological Consultants, who is independent of T2 Metals Corp. and serves as the Qualified Person for the purposes of NI 43-101. Anders Hogrelius has verified the data disclosed herein, including the sampling, analytical, and QA/QC procedures underlying the resource estimate, and has approved the disclosure of the scientific and technical information contained in this release.
The scientific and technical information in this news release, including the Mineral Resource Estimate, has been prepared and reviewed by Bouke van `t Riet, SME, FSAIMM (QP) ENG (Licence No(s). 04163279, 703518), of Arundon Mining Solutions Oy, who is independent of T2 Metals Corp. and serves as the Qualified Person for the purposes of NI 43-101. Bouke van `t Riet has verified the data disclosed herein, including the sampling, analytical, and QA/QC procedures underlying the resource estimate, and has approved the disclosure of the scientific and technical information contained in this release.
Strategic Context
The 2026 outlook for copper remains exceptionally strong, driven by accelerating demand from AI data centres, electrical grid expansion, and persistent global supply deficits. Market commentators (e.g. Chamath Palihapitiya) have widely cited copper as the "best trade of 2026," as supply constraints at major global mines coincide with a structural shift in demand.
Goetz, P., & Froese, E., 1981, The Sherritt Gordon Massive Sulphide Deposit. Precambrian Sulphide Deposits, H.S. Robinson Memorial Volume, edited by R.W. Hutchinson, C.D. Spence and J.M. Franklin, Geological Association of Canada Special Paper 25, 1982.
Disclaimers
The Qualified Person (as defined under National Instrument 43-101 – Standards of Disclosure for Mineral Projects) for the Company's projects, Mr. Mark Saxon, the Company's President & CEO, a Fellow of the Australasian Institute of Mining and Metallurgy and a Member of the Australian Institute of Geoscientists, has reviewed and approved the contents of this release.
About T2 Metals Corp. (TSXV: TWO) (OTCQB: TWOSF) (FSE: WJ6)
T2 Metals Corp is an emerging precious and critical strategic metals company enhancing shareholder value through exploration and discovery. T2 Metals is committed to engage with rights holders and stakeholders with the highest level of respect, ensuring that our exploration activities contribute positively to the communities in which we operate.
Neither the TSX Venture Exchange nor its Regulation Services Provider (as that term is defined in the policies of the TSX Venture Exchange) accepts responsibility for the adequacy or accuracy of this release.
Cautionary Note Regarding Forward-Looking Statements
Mineral Resources that are not Mineral Reserves do not have demonstrated economic viability. The estimate of Mineral Resources may be materially affected by environmental, permitting, legal, title, taxation, socio-political, marketing or other relevant issues. The quantity and grade of reported Inferred Mineral Resources are uncertain in nature and there has been insufficient exploration to define these Inferred Mineral Resources as Indicated or Measured Mineral Resources. It is uncertain if further exploration will result in upgrading them to the Indicated or Measured category.
Certain information set out in this news release constitutes forward-looking information. Forward looking statements are often, but not always, identified by the use of words such as "seek", "anticipate", "plan", "continue", "estimate", "expect", "may", "will", "intend", "could", "might", "should", "believe" and similar expressions. Forward-looking statements are based upon the opinions and expectations of management of the Company as at the effective date of such statements and, in certain cases, information provided or disseminated by third parties. Although the Company believes that the expectations reflected in forward-looking statements are based upon reasonable assumptions, and that information obtained from third party sources is reliable, they can give no assurance that those expectations will prove to have been correct. Readers are cautioned not to place undue reliance on forward-looking statements.
These forward-looking statements are subject to a number of risks and uncertainties. Actual results may differ materially from results contemplated by the forward-looking statements. Accordingly, the actual events may differ materially from those projected in the forward-looking statements. Such risks include uncertainties relating to exploration activities. When relying on forward-looking statements to make decisions, investors and others should carefully consider the foregoing factors and other uncertainties and should not place undue reliance on such forward-looking statements. The Company does not undertake to update any forward-looking statements, except as may be required by applicable securities laws.
APPENDIX 1
References for Third-Party Resources, Figure 1
Tartan Lake
Lane, T., Samari, H., Harvey, T. and Breckenridge, L. (Global Resource Engineering, GRE), 2025, Mineral Resource Estimate NI 43-101 Technical Report Tartan Mine Project, Manitoba, Canada; effective date December 31, 2025, filed on SEDAR+ May 4, 2026.
Pine Bay
Kirkham Geosystems Ltd., 2023, NI 43-101 Technical Report, Pine Bay Project, Manitoba, Canada; prepared for Callinex Mines Inc., effective date July 10, 2023, filed on SEDAR August 28, 2023.
McIlvenna Bay
Foran Mining Corporation, 2025, NI 43-101 Technical Report on the McIlvenna Bay Project, Saskatchewan, Canada; effective date and report date March 12, 2025, filed on SEDAR+ March 12, 2025.
Lalor & 1901
Hudbay Minerals Inc., 2026, Annual Mineral Reserve and Resource Update, effective date January 1, 2026, published March 27, 2026. Available at www.hudbayminerals.com.
To view the source version of this press release, please visit https://www.newsfilecorp.com/release/296382

© 2026 Canjex Publishing Ltd. All rights reserved.