Game Consoles and OTT Devices Grew Fastest as Access Points for
Online TV; Movies Surpass Sports Content in Online Viewing

Company Website:
http://www.adobe.com
SAN JOSE, Calif. -- (Business Wire)
Adobe (Nasdaq:ADBE) today released its Video
Benchmark Report, which analyzes online TV (TV Everywhere) and
other, non-authenticated online video trends. Key findings of the Adobe
Digital Index report show that more people watched more TV online than
ever before. TV consumption across devices grew 388 percent
year-over-year (YoY) and programmers saw broader use as unique monthly
viewers increased by 146 percent YoY across browsers and TV apps. While
online TV consumption remains fragmented across platforms, gaming
consoles and over-the-top (OTT) devices gained the largest percentage of
market share and Android apps surpassed desktop browsers as access
points for watching TV online.
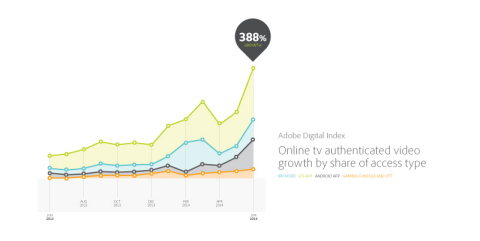
Online TV authenticated video growth by share of access type. (Photo: Business Wire)
Adobe’s Video Benchmark Report is the most comprehensive report of its
kind in the industry. The findings are based on aggregated and anonymous
data from more than 1,300 media and entertainment properties using Adobe
Marketing Cloud and Adobe Primetime. The report includes 165 billion
total online video starts and 1.53 billion TV Everywhere authentications
across 250 pay-TV service providers covering 99 percent of pay-TV
households in the U.S. The analysis also examined TV Everywhere content
from 105 TV channels and more than 300 TV apps and sites.
“Consumers’ content consumption habits are changing rapidly,” said
Jeremy Helfand, vice president, Primetime at Adobe. “Viewers expect
seamless, more personalized viewing experiences across an
ever-increasing number of devices, and broadcasters, media companies and
advertisers must transform their digital strategies to optimize the
viewing experience.”
Additional findings include:
- Online TV Consumption: TV consumption across devices grew 388
percent YoY, driven in part by the World Cup, a major online TV event
this summer. Broadcast and cable networks with direct-to-consumer
online TV offerings saw their unique monthly viewership grow by 146
percent YoY across all online TV channels while the amount of online
TV content watched per viewer grew by 55 percent YoY. 105 TV channels
now power more than 300 online TV sites and apps in the U.S.
- Platform Fragmentation: Of all device types, game consoles and
OTT devices saw the biggest market share increase (194 percent YoY),
now representing ten percent of all online TV consumption, up from
three percent in 2013. The online TV market share for Android apps
grew to 20 percent, an increase of 28 percent, surpassing browsers,
which shrank to 19 percent market share, a 41 percent decline YoY. iOS
apps still lead in market share with 51 percent.
- Online TV Content: For the first time, watching movies online
exceeded watching sports content. Movie networks saw the strongest
gain in viewing frequency, a 125 percent increase YoY from two movies
to now 4.5 movies on average per month. Broadcast and cable networks
saw an increase of 81 percent YoY for episodic content watched each
month. Viewers watched 4.2 sporting events on average across sports
networks, a modest monthly increase of 31 percent.
- Online Video (non-authenticated) Content: Viewing of online
videos on smartphones (14 percent share) surpassed tablets (13 percent
share) for the first time. Game consoles and OTT devices realized the
highest market share growth with 127 percent YoY. Viewers watched
videos on desktops the longest and were three times more likely to
finish 75 percent of the content. Only 17 percent of videos on
smartphones were watched through 75 percent completion.
Helpful Links
About Adobe Digital Index
Adobe Digital Index publishes research on digital marketing and other
topics of interest to senior marketing and e-commerce executives across
industries. Research is based on the analysis of select, anonymous and
aggregated data from over 5,000 companies worldwide that use Adobe
Marketing Cloud to obtain actionable data and analysis of activity on
their websites. The Video Benchmark Report and other reports and
insights are available here.
About Adobe Systems Incorporated
Adobe is changing the world through digital experiences. For more
information, visit www.adobe.com.
© 2014 Adobe Systems Incorporated. All rights reserved. Adobe and the
Adobe logo are either registered trademarks or trademarks of Adobe
Systems Incorporated in the United States and/or other countries. All
other trademarks are the property of their respective owners.

Photos/Multimedia Gallery Available: http://www.businesswire.com/multimedia/home/20141020006744/en/
Contacts:
Adobe Systems Incorporated
Stefan Offermann, 408-536-4023
sofferma@adobe.com
or
Text
100
Melissa Chanslor, 415-593-8465
adobe@text100.com
Source: Adobe Systems Incorporated
© 2024 Canjex Publishing Ltd. All rights reserved.